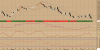
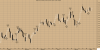
GBP/USD DAILY as of Friday, 03 January, 2014
*** Intra-Daily Trading Strategy: BUY British Pound / US Dollar
Buy Target: 1.6456
Buy Stop: 1.6425
Enter New BUY on OPEN and exit BUY positions at Target price or at Stop price.
(NOTE: Adjust Stop Loss Price according to your trading risk.)
Do not reverse after exiting. This is a recommendation for INTRA-DAY TRADING only!!!!!
A black body has formed as prices closed lower than open.
The previous 10 candlestick bars, there are 7 white candles versus 3 black candles with a net of 4 white candles.
The previous 50 candlestick bars, there are 29 white candles versus 21 black candles with a net of 8 white candles.
A spinning top has formed which is a candle with a small real body. Spinning tops identify a session in which there is little price action as defined by the difference between the open and the close. During a rally or near new highs, a spinning top can be a sign that prices are losing momentum and the bulls may be in trouble.
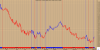
MACD is BULLISH as the MACD is above the signal line. The MACD crossed above the signal line 4 period(s) ago. Since the MACD crossed the MACD moving average, British Pound / US Dollar's price has decreased 0.27%, and has been fluctuating from a high of 1.660 to a low of 1.641.
RSI was a Sell 1 period(s) ago.
Directional Movement Indicators (DMI) currently is not indicating a specific price direction.
SAR signal was a Buy 12 period(s) Ago.
The close is currently
ABOVE its 200 daily moving average
ABOVE its 50 daily moving average
ABOVE its 20 daily moving average
The current market condition for British Pound / US Dollar is Very Bullish
British Pound / US Dollar closed below the upper Bollinger Band by 35.9%. Bollinger Bands are 35.75% narrower than normal. The current width of the Bollinger Bands (alone) does not suggest anything conclusive about the future volatility or movement of prices.
Elliott Waves High Volatility has detected an Isolated Low at 1.64 one bar ago ; this is usually a bullish sign that is not to be used alone! Elliott Waves High Volatility has detected an Isolated High at 1.66 one bar ago; this is usually a bearish sign that is not to be used alone!
The present wave patterns are:
fast amplitude (8%): bullish wave 3
British Pound / US Dollar is long term Bullish as the 144 days moving average of 1.60 is increasing. The Relative Strength Index is at 56.60 in the neutral territory. The Relative Momentum Index is at 77.97 in the overbought territory. An important indicator for Elliott waves, the Elliott oscillator is at 0.02, in positive territory; this is a bullish sign. An equally important indicator, the STORSI is at 39.48. This value is in the neutral territory.
British Pound / US Dollar is currently 4.8% above its 200-period moving average and is in an upward trend. Volatility is extremely high when compared to the average volatility over the last 10 periods. There is a good possibility that volatility will decrease and prices will stabilize in the near term. Trend forecasting oscillators are currently bullish on GBPUSD and have had this outlook for the last 31 periods.
Overall, the bias in prices is: Upwards.
Short term: Prices are stalling.
Intermediate term: Prices are ranging.
*** Intra-Daily Trading Strategy: BUY British Pound / US Dollar
Buy Target: 1.6456
Buy Stop: 1.6425
Enter New BUY on OPEN and exit BUY positions at Target price or at Stop price.
(NOTE: Adjust Stop Loss Price according to your trading risk.)
Do not reverse after exiting. This is a recommendation for INTRA-DAY TRADING only!!!!!
A black body has formed as prices closed lower than open.
The previous 10 candlestick bars, there are 7 white candles versus 3 black candles with a net of 4 white candles.
The previous 50 candlestick bars, there are 29 white candles versus 21 black candles with a net of 8 white candles.
A spinning top has formed which is a candle with a small real body. Spinning tops identify a session in which there is little price action as defined by the difference between the open and the close. During a rally or near new highs, a spinning top can be a sign that prices are losing momentum and the bulls may be in trouble.
MACD is BULLISH as the MACD is above the signal line. The MACD crossed above the signal line 4 period(s) ago. Since the MACD crossed the MACD moving average, British Pound / US Dollar's price has decreased 0.27%, and has been fluctuating from a high of 1.660 to a low of 1.641.
RSI was a Sell 1 period(s) ago.
Directional Movement Indicators (DMI) currently is not indicating a specific price direction.
SAR signal was a Buy 12 period(s) Ago.
The close is currently
ABOVE its 200 daily moving average
ABOVE its 50 daily moving average
ABOVE its 20 daily moving average
The current market condition for British Pound / US Dollar is Very Bullish
British Pound / US Dollar closed below the upper Bollinger Band by 35.9%. Bollinger Bands are 35.75% narrower than normal. The current width of the Bollinger Bands (alone) does not suggest anything conclusive about the future volatility or movement of prices.
Elliott Waves High Volatility has detected an Isolated Low at 1.64 one bar ago ; this is usually a bullish sign that is not to be used alone! Elliott Waves High Volatility has detected an Isolated High at 1.66 one bar ago; this is usually a bearish sign that is not to be used alone!
The present wave patterns are:
fast amplitude (8%): bullish wave 3
British Pound / US Dollar is long term Bullish as the 144 days moving average of 1.60 is increasing. The Relative Strength Index is at 56.60 in the neutral territory. The Relative Momentum Index is at 77.97 in the overbought territory. An important indicator for Elliott waves, the Elliott oscillator is at 0.02, in positive territory; this is a bullish sign. An equally important indicator, the STORSI is at 39.48. This value is in the neutral territory.
British Pound / US Dollar is currently 4.8% above its 200-period moving average and is in an upward trend. Volatility is extremely high when compared to the average volatility over the last 10 periods. There is a good possibility that volatility will decrease and prices will stabilize in the near term. Trend forecasting oscillators are currently bullish on GBPUSD and have had this outlook for the last 31 periods.
Overall, the bias in prices is: Upwards.
Short term: Prices are stalling.
Intermediate term: Prices are ranging.