Daily Market Forecast By Capitalcore

USD CAD chart bullish trend continuation outlook

The USD/CAD forex pair, known as the "Loonie," reflects the exchange rate between the U.S. Dollar and Canadian Dollar, and is a key pair for traders following North American economic ties. Today’s USD focus is on a series of high-impact Federal Reserve events, with Boston Fed President Susan Collins and Cleveland Fed President Beth Hammack scheduled to speak, while the centerpiece is Fed Chair Jerome Powell’s remarks at the Jackson Hole Economic Policy Symposium. Any hawkish tone could strengthen the U.S. Dollar, as traders will interpret it as a signal for prolonged higher interest rates. On the Canadian side, Retail Sales data will be released, providing insight into consumer demand. Strong figures could support the CAD, but any weakness may weigh on the currency, particularly if Powell signals further Fed tightening. Given the significance of today’s U.S. and Canadian news, volatility in USD/CAD is expected, making this a critical session for both fundamental and technical traders analyzing the USD/CAD daily chart technical and fundamental analysis.
H4_USDCAD_Chart_Price_Analysis_and_Movement_Outlook_on_08_22_2025.jpg
Chart Notes:
• Chart time-zone is UTC (+03:00)
• Candles’ time-frame is 4h.

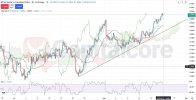
Looking at the USD/CAD H4 chart technical analysis, the price shows a correction is being started after the long and strong bearish trend that happened from February 2025. As visible in the image, the pair is now moving upward, signaling a bullish reversal. The Ichimoku indicator supports this trend as the price trades above the green cloud. The lower band of the cloud is flat, while the upper band is moving higher, and the cloud has widened slightly, which confirms strengthening bullish momentum. The cloud being green further reinforces this bullish sentiment. Additionally, the %R indicator currently sits at -12.20, indicating that the pair is in overbought conditions, meaning that while momentum remains strong to the upside, traders should anticipate potential short-term pullbacks or consolidation before another leg higher. This aligns with price action analysis that suggests the USD/CAD bullish trend continuation is intact on the H4 timeframe.

•DISCLAIMER: Please note that the above analysis is not an investment suggestion by “Capitalcore LLC”. This post has been published only for educational purposes.

Capitalcore
 
Kiwi Dollar Technical and Fundamental Insights

The NZD/USD forex pair, often nicknamed the “Kiwi”, represents the exchange rate between the New Zealand Dollar and the US Dollar. This pair is widely followed by traders for its sensitivity to commodity prices, interest rate differentials, and economic indicators from both New Zealand and the United States.
From a fundamental perspective, today’s NZD/USD price action is likely to be influenced by New Zealand’s retail sales data, which measures the total value and volume of inflation-adjusted sales, including and excluding automobiles and gas stations. Stronger-than-expected retail sales, signaling robust consumer spending, would typically be bullish for NZD. On the USD side, traders will focus on the New Residential Sales data and any hawkish commentary from Federal Reserve Bank of Dallas President Lorie Logan. Positive U.S. housing data or hawkish signals could strengthen the USD and apply downward pressure on NZD/USD. Considering these releases, the Kiwi may experience short-term volatility, with potential rebounds if NZ retail sales surprise on the upside, but downward pressure could persist if U.S. indicators are stronger than expected.
H4-NZDUSD-Chart-Price-Analysis-and-Movement-Outlook-on-08.25.2025.webp

Chart Notes:
• Chart time-zone is UTC (+03:00)
• Candles’ time-frame is 4h.

Analyzing the H4 chart of NZD/USD, the price is moving in a bearish trend within a downward channel, fluctuating between the upper and lower channel boundaries. Recently, after touching the bottom of the channel, the price rebounded toward the middle, yet it remains below the Ichimoku Cloud, which has expanded and turned red, signaling continued bearish momentum. The last candle is near the Ichimoku Base Line (Kijun-sen), which has acted as resistance so far. Additionally, the %R 14 indicator is at -11.01, indicating the pair is approaching overbought levels in the short-term bounce, suggesting that the bearish trend may resume after the current corrective move. Overall, NZD/USD is showing bearish dominance with short-term upward corrections, and traders should watch the Ichimoku levels and %R for potential reversals or continuation of the downtrend.

•DISCLAIMER: Please note that the above analysis is not an investment suggestion by “Capitalcore LLC”. This post has been published only for educational purposes.

Capitalcore
 
Technical Correction or Bullish Resumption for GBP USD

GBP/USD, commonly referred to as "Cable," is one of the most widely traded forex pairs globally. It represents the British Pound against the US Dollar and is known for its volatility and liquidity. Today, fundamental analysis highlights key economic events influencing both currencies. For GBP, the British Retail Consortium (BRC) price data release and a speech by Bank of England MPC Member Catherine Mann could impact sentiment, especially if the BRC figures indicate rising inflation or if Mann hints at a more hawkish monetary stance. On the USD side, speeches from Federal Reserve officials John Williams and Thomas Barkin, combined with reports on Durable Goods Orders and housing indices, could drive volatility—particularly if hawkish tones or stronger-than-expected economic data emerge, supporting the dollar's strength.
Technical-Correction-or-Bullish-Resumption-for-GBP-USD.webp

Chart Notes:
• Chart time-zone is UTC (+03:00)
• Candles’ time-frame is 4h.

Analyzing the GBP/USD H4 chart reveals an overall bullish trend currently undergoing a bearish correction. The recent price action suggests the correction phase might have concluded, with prices stabilizing around the 0.236 Fibonacci expansion level. If bullish momentum resumes, targets at 0.382 or 0.5 Fibonacci levels are likely. However, continued bearish pressure could see the pair testing support around the historically significant 1.33989 level. Ichimoku analysis indicates a flat Senkou Span B above current candles, suggesting possible consolidation. MACD shows the histogram at 0.00058, with the MACD line just above zero at 0.00007 and the signal line at -0.00051, implying tentative bullish signals. Meanwhile, the RSI hovers near neutral at 46.33, indicating market indecision.

•DISCLAIMER: Please note that the above analysis is not an investment suggestion by “Capitalcore LLC”. This post has been published only for educational purposes.

Capitalcore
 
EUR/USD Steady Ahead of Key Consumer Sentiment

EUR/USD, the most actively traded currency pair in the world, reflects the euro against the US dollar and is heavily influenced by macroeconomic events on both sides of the Atlantic. Today, euro traders are focused on the release of NIQ’s consumer sentiment index, which gauges optimism or pessimism among households and serves as a leading indicator for spending trends in the eurozone. A stronger-than-expected reading could bolster the euro by signaling resilience in consumer confidence. On the US side, attention turns to energy-related data, with the American Petroleum Institute (API) and Energy Information Administration (EIA) crude oil inventory reports scheduled this week. Although typically more impactful for oil-sensitive currencies like the Canadian dollar, sharp swings in oil supply-demand dynamics can spill over into USD sentiment through inflation expectations. Additionally, a speech by Federal Reserve Bank of Richmond President Thomas Barkin, titled “Why the Consumer Matters”, is closely watched for policy cues; any hawkish tone reinforcing tighter monetary policy could strengthen the dollar, driving volatility in EUR/USD.
eurusd 08.27.png
Chart Notes:
• Chart time-zone is UTC (+03:00)
• Candles’ time-frame is 4h.

Analyzing the EUR/USD H4 chart shows the pair consolidating within a key support zone around 1.1600–1.1570, marked by repeated price reactions. The Ichimoku Cloud highlights ongoing indecision, with candles fluctuating inside the cloud and a downward sloping trendline suggesting persistent bearish pressure. However, the RSI is positioned near neutral at 47, reflecting market indecision rather than strong directional momentum. Meanwhile, the ATR at 0.00309 signals relatively low volatility, pointing to subdued price swings in the near term. A breakout above the descending trendline could trigger bullish continuation toward the 1.1700 zone, while sustained selling pressure may drive the pair below the highlighted support, opening the path toward 1.1500.

•DISCLAIMER: Please note that the above analysis is not an investment suggestion by “Capitalcore LLC”. This post has been published only for educational purposes.

Capitalcore
 
USDCAD Price Analysis and Movement Outlook

Based on the upcoming economic events, the USDCAD pair, nicknamed the "Loonie" due to the Canadian one-dollar coin featuring a loon, is poised for a volatile day. The fundamental outlook is complex as multiple high-impact US data releases clash with a single, but significant, Canadian GDP report. With Federal Reserve Governor Christopher Waller's speech on monetary policy, the US dollar's strength will be heavily influenced by any hawkish remarks about interest rates and inflation containment, particularly ahead of the US Core PCE price index release - the Fed's preferred inflation gauge. A higher-than-forecast Core PCE, coupled with positive readings from other reports like Personal Income and Expenditures, the Chicago PMI, and UoM consumer sentiment, could signal a resilient US economy, providing strong bullish momentum for the USD. Conversely, a weaker-than-expected Canadian GDP figure would further disadvantage the Canadian dollar, potentially reinforcing the bullish USD/CAD forex trend. Traders will be closely monitoring these releases for price action clues on the USD CAD daily chart technical analysis.
H4-USDCAD-Chart-Price-Analysis-and-Movement-Outlook-on-08.29.2025.webp

Chart Notes:
• Chart time-zone is UTC (+03:00)
• Candles’ time-frame is 4h.

The USD/CAD H4 live chart technical analysis today shows the pair is in a long-term slightly bullish trend, but has recently experienced a short-term bearish correction. The Loonie price has moved from around 1.39250 to 1.37400 over the last six days. However, recent price action suggests a potential reversal as the last two candles have corrected upward after touching a key support level, which is highlighted by a red box. This support level will be a crucial point to watch for traders. A significant challenge for the bulls is the bearish trend line, which is acting as the first resistance. A breakout above this trend line and the red rectangle would be a bullish signal and a key confirmation of a sustained upward move. The price is also trading below the red Ichimoku cloud, which has expanded and whose bands are moving downward, signaling a strong bearish sentiment in the short-term forex trend. Additionally, the Williams %R 14 indicator is at -90.02, which indicates that the pair is significantly oversold, and supports the possibility of an upward correction or a trend reversal. Traders should look for a break of the bearish trend line and the Ichimoku cloud to confirm a new bullish price action.

•DISCLAIMER: Please note that the above analysis is not an investment suggestion by “Capitalcore LLC”. This post has been published only for educational purposes.

Capitalcore
 
AUD USD price action chart outlook

The AUD/USD, also known by traders as the “Aussie”, is one of the most actively traded currency pairs in the forex market, often influenced by commodity prices and risk sentiment. Today’s focus on the AUDUSD pair comes as Australia releases several high-impact indicators including the Melbourne Institute CPI, ANZ job advertisements, building approvals, corporate profits, and the RBA commodity price index, while in the U.S., markets remain quiet due to the Labor Day holiday. Fundamentally, stronger-than-expected CPI and building approvals would boost the Aussie as they reflect underlying inflationary pressures and construction sector growth, while an uptick in corporate profits and commodity prices would further strengthen the outlook by signaling resilience in domestic demand and trade balance. However, thin U.S. liquidity due to the holiday could result in irregular volatility, meaning traders should be cautious of sudden price swings despite the broadly supportive Australian data backdrop.
H4_AUDUSD_Analysis-and-price-action_on_09.01.2025-.webp

Chart Notes:
• Chart time-zone is UTC (+03:00)
• Candles’ time-frame is 4h.

On the AUD/USD H4 chart technical analysis, the price is moving on a bullish short-term trend, with the last two bullish candles testing the 0.618 Fibonacci retracement level near 0.6547, which aligns with the long-term bearish descending trend line. Despite this recovery, the price action is still fluctuating between the 0.5 and 0.618 Fibonacci retracement zones, suggesting consolidation within a broader range. The Ichimoku Cloud is positioned below the candles, turning green with widening structure, while the Leading Span A is moving upward, reinforcing bullish sentiment. Momentum is also supported by the %R (14) at -2.78, indicating the pair is near overbought territory, yet still showing strong bullish pressure. Overall, AUD-USD price action suggests short-term upside potential, but traders should monitor the 0.6547–0.6560 resistance area closely as a decisive break above it could open the door toward 0.6580, while rejection may pull the pair back into the consolidation zone.

•DISCLAIMER: Please note that the above analysis is not an investment suggestion by “Capitalcore LLC”. This post has been published only for educational purposes.

Capitalcore
 
EUR/USD H4 chart symmetrical triangle breakout watch

The EUR/USD currency pair, also known as the “Fiber”, is the most traded forex pair in the world, representing the euro against the US dollar. As the benchmark for global forex markets, EUR-USD often reflects the relative economic health of the Eurozone and the United States, making it highly sensitive to macroeconomic data and central bank policy statements.
From a fundamental perspective, today’s EUR/USD price action will likely be influenced by key Eurozone data releases including S&P Global Services PMI and Producer Price Index (PPI), alongside remarks from ECB President Christine Lagarde at the ESRB Conference in Frankfurt. Stronger-than-expected PMI readings above the 50 expansion threshold could support the euro, signaling improving business activity. Meanwhile, Lagarde’s tone on monetary policy could introduce volatility, especially if she leans hawkish amid inflationary concerns. On the US side, the dollar awaits market-moving events such as the JOLTS job openings report, factory orders, and speeches by Fed officials Alberto Musalem and Neel Kashkari. Hawkish Fed commentary or stronger labor and manufacturing data could strengthen the dollar, potentially limiting euro gains. The balance between Eurozone PMI resilience and Fed rate expectations will likely dictate the short-term EURUSD trend.
H4_EURUSD-chart-symmetrical-triangle-breakout-watch_Analysis-on_09.03.2025-.webp

Chart Notes:
• Chart time-zone is UTC (+03:00)
• Candles’ time-frame is 4h.

On the technical analysis side, the EUR USD H4 chart shows the price moving within a symmetrical triangle pattern, squeezed between a bearish descending trendline and a bullish ascending trendline. The bullish trendline, which has acted as a support level multiple times, once again held as the price bounced back upward after testing it. The last candlestick is entering the Ichimoku Cloud, suggesting a zone of consolidation and potential indecision, while the previous three candles form a Three Inside Down bearish pattern, hinting at possible downside pressure. The Ichimoku Leading Span B is moving horizontally, signaling a lack of strong momentum in either direction. Resistance remains around 1.1700, a key level that traders are watching closely. Meanwhile, the Williams %R indicator at -77.94 shows the pair approaching oversold territory as the plot moves downward toward -80, suggesting potential for a rebound if selling pressure eases. Price action traders will likely monitor whether EUR/USD can break above the triangle resistance or fall below the ascending trendline support to confirm the next directional move.

•DISCLAIMER: Please note that the above analysis is not an investment suggestion by “Capitalcore LLC”. This post has been published only for educational purposes.

Capitalcore
 
USDCAD chart outlook with NFP impact

The USD/CAD, often referred to as the “Loonie,” is one of the most actively traded forex pairs, reflecting the economic strength of the United States and Canada. Today’s market sentiment is largely driven by critical U.S. data releases, including Non-Farm Payrolls (NFP), Unemployment Rate, and Average Hourly Earnings, as well as Canadian employment and labor data. A stronger-than-expected U.S. labor market report would reinforce expectations of Federal Reserve hawkishness, especially with Chicago Fed President Austan Goolsbee speaking later today, which could boost the U.S. Dollar. On the other hand, robust Canadian employment data could strengthen the CAD and put downside pressure on USDCAD. Given that both countries are releasing labor market indicators today, volatility and sharp price action are highly likely, making this session crucial for traders focusing on the USD CAD daily chart, fundamental analysis, and forex price action strategies.
H4_-USDCAD-forex-market-outlook-with-employment-data_-09.05.2025.webp

Chart Notes:
• Chart time-zone is UTC (+03:00)
• Candles’ time-frame is 4h.

From the technical perspective on the USD/CAD H4 chart, the price has been correcting after a strong bearish trend line but has recently shifted into a bullish structure. It bounced from the 0.5 Fibonacci retracement level, which acted as a powerful support zone, and has already broken above the 0.618 level, currently trading near the 0.786 retracement. This area aligns with the Ichimoku Cloud’s upper band (Leading Span B), creating a significant resistance zone near 1.3816–1.3851. If price sustains momentum above this level, it could retest the 1.38799 Fibonacci extension resistance. However, the Ichimoku Cloud shows mixed signals: the Span B is flat, while Span A is rising with a thick cloud, suggesting consolidation risk. Meanwhile, the %R (14) at -39.07 is pointing sharply downward, hinting at potential short-term weakness before a new bullish attempt. Traders should closely watch whether price can hold above the 1.3815–1.3850 resistance zone to validate a continuation toward 1.3880 and beyond.

•DISCLAIMER: Please note that the above analysis is not an investment suggestion by “Capitalcore LLC”. This post has been published only for educational purposes.

Capitalcore
 
USDCHF H4 Chart Indicates Potential Short-term Consolidation

USD/CHF, commonly known as the "Swissie," represents the pairing of the U.S. dollar and Swiss franc, reflecting economic interactions between the United States and Switzerland. The Swissie is particularly influenced by risk sentiment due to Switzerland's status as a global financial haven. Fundamentally, today's key news events will include SNB Chairman Martin Schlegel’s speech titled "Future-proofing central banks," which traders will closely monitor for monetary policy insights; a hawkish tone could strengthen the CHF. On the USD side, the NFIB Small Business Index data release will be critical, as a higher-than-expected index reading typically supports the dollar by signaling robust economic conditions for small businesses in the U.S. Additionally, the weekly American Petroleum Institute (API) data may influence short-term sentiment around the USD.
USDCHF-H4-Chart-Indicates-Potential-Short-term-Consolidation.webp

Chart Notes:
• Chart time-zone is UTC (+03:00)
• Candles’ time-frame is 4h.

Technically analyzing the USD/CHF H4 chart, the overall market trend remains bearish, with recent price action forming a corrective side market. Candlesticks attempted a bullish reversal reaching up to the 0.81646 level but failed to surpass this resistance. Currently, price action is testing a critical support zone at around 0.79190, a level previously tested but unbroken. Given the strong bearish momentum, it appears unlikely that the market will breach this support level immediately. However, a break below could target the Fibonacci extension level at 0.236 as the next significant support area. Stochastic indicators reinforce this scenario, with the %K line at 2.91 and %D line at 5.24, signaling oversold conditions and potential short-term consolidation or reversal. Additionally, MACD indicators reveal bearish sentiment, with the histogram at -0.00098, MACD line at -0.00258, and the signal line at -0.000160, reinforcing the downward price momentum.

•DISCLAIMER: Please note that the above analysis is not an investment suggestion by “Capitalcore LLC”. This post has been published only for educational purposes.

Capitalcore
 
Technical Triangle Signals Bullish Momentum for S&P500

The S&P 500 Index, widely known as "SPX" or simply the "S&P," represents the 500 leading publicly traded companies in the U.S., and is a primary benchmark for U.S. equities. Fundamental analysis indicates that today's release of significant U.S. economic data, including the Consumer Price Index (CPI) and initial jobless claims, may impact market sentiment. A stronger-than-forecast CPI, particularly the Core CPI excluding food and energy, could signal potential tightening of monetary policy by the Federal Reserve, leading to increased volatility and influencing investor behavior in equities, especially the S&P500. Conversely, if jobless claims come in below expectations, it would reflect economic strength, possibly bolstering confidence and investor risk appetite, positively affecting the S&P500's price action.
SP500_jpgTechnical_Triangle_Signals_Bullish_Momentum_for_SP500.webp

Chart Notes:
• Chart time-zone is UTC (+03:00)
• Candles’ time-frame is 4h.

Analyzing the uploaded S&P500 H4 chart, the candles recently have created a classic triangle pattern with ascending lows, indicating a positive pulse in its current bullish trend. Now that the candles have broken the upper resistance line of the triangle, the next anticipated target for this bullish momentum could be around the resistance level at 6770.12. However, should the price action reverse, the support level at 6400.44, where candles previously found strong buying pressure, could become a key target. Examining the indicators, the Stochastic oscillator shows the K% line at 69.91 and the D% line at 68.85, suggesting room for further upward momentum before reaching an overbought territory. The MACD histogram at 0.67, with the MACD line at 15.05 above the signal line at 14.37, corroborates the bullish scenario. Additionally, the recent candles are trading above the moving average, reinforcing the bullish bias.

•DISCLAIMER: Please note that the above analysis is not an investment suggestion by “Capitalcore LLC”. This post has been published only for educational purposes.

Capitalcore
 
XAU/USD chart trend and forex analysis

XAU/USD, also known as “Gold” or “GOLDUSD,” is one of the most traded safe-haven assets in the forex and commodities market. Gold is highly sensitive to US Dollar movements, inflation expectations, and overall market sentiment, making it a crucial pair for daily chart technical and fundamental analysis. From a fundamental perspective, traders today are closely watching the University of Michigan Consumer Sentiment Index and Inflation Expectations data, which historically have a strong influence on USD price action. Higher-than-expected confidence or inflation readings would strengthen the US Dollar and put pressure on Gold prices, while weaker results could support bullish momentum for XAU/USD. Since consumer confidence drives household spending and inflation expectations guide future wage and monetary policy dynamics, today’s news release has the potential to create notable volatility in Gold’s short-term price action.
XAUUSD_H4_Chart-trend-and-Forex-Analysis-09.12.2025-.webp

Chart Notes:
• Chart time-zone is UTC (+03:00)
• Candles’ time-frame is 4h.

On the XAU/USD H4 chart, the price is consolidating inside a rectangle with a flat lower boundary after recording a new all-time high on September 9th. The asset has shifted from the upper regression channel to the lower zone, with a Pearson’s R of 0.9767, confirming the strength of the trend correlation. After touching the lower band of the regression channel and the rectangle’s flat base, Gold has shown signs of recovery, forming three green candles out of the last four. Currently, the candles remain above the Ichimoku Cloud, with the last three candles moving along the conversion line, while the green cloud continues its upward slope, signaling bullish momentum. The candles are trading between the Ichimoku baseline (below price) and the lagging span (above price), reinforcing a supportive technical structure. Meanwhile, the %R oscillator sits at -49.92, reflecting neutral momentum with potential for continuation either side, though the price action leans slightly bullish after the recent corrective move.

•DISCLAIMER: Please note that the above analysis is not an investment suggestion by “Capitalcore LLC”. This post has been published only for educational purposes.

Capitalcore
 
Bitcoin versus US Dollar chart forecast

Bitcoin, often referred to as "digital gold" or simply BTC, paired with the US Dollar (BTC/USD), is one of the most traded and analyzed currency pairs in the forex and crypto markets. This pair reflects the performance of the world’s leading cryptocurrency against the world’s reserve currency, making it a key benchmark for traders tracking both digital assets and traditional markets.
From a fundamental perspective, today’s upcoming release of the New York Manufacturing Index could weigh on USD sentiment. A stronger-than-expected reading would support the US Dollar, potentially applying downside pressure on BTC/USD as dollar demand rises. Conversely, weaker data would signal economic softness, prompting traders to price in more dovish expectations from the Federal Reserve, which may boost Bitcoin’s appeal as an alternative store of value. Given the anticipation around today’s release, traders should watch for heightened volatility in the BTC/USD pair as fundamental forces interact with current technical positioning.
H4_BTCUSD_Bitcoin-versus-US-Dollar-chart-forecast_09.15.2025-.webp

Chart Notes:
• Chart time-zone is UTC (+03:00)
• Candles’ time-frame is 4h.

From a technical perspective on the BTC/USD H4 chart, the price is currently moving in an ascending trendline after previous corrections and a sharp descending phase that retraced to the 0.236 Fibonacci level. Since then, Bitcoin has established bullish momentum, with price action now trading above the Ichimoku green cloud and recently testing the 0.618 Fibonacci retracement level as the new week opens. The latest candles are forming above both the base line (Kijun-sen) and conversion line (Tenkan-sen), with the new candle opening strongly above both indicators and the cloud, reinforcing bullish bias. On the MACD indicator, the MACD line (1003.55) is positioned above the signal line (876.86), showing continued momentum in favor of buyers. Together, these signals indicate that BTC/USD maintains a bullish setup in the short term, but traders should remain cautious around key Fibonacci resistance levels and incoming USD data that could trigger short-lived volatility.

•DISCLAIMER: Please note that the above analysis is not an investment suggestion by “Capitalcore LLC”. This post has been published only for educational purposes.

Capitalcore