In any field of activity, in order to achieve a positive result, the activity must be conscious. Trading, as a field of activity, is no exception. But even this is not enough. Market participants do not have a common opinion about the market itself, about the processes taking place on it, as a result of which there are many trading approaches, systems, sometimes far from the market. So it turns out that the system allegedly stopped working and the trader is looking for, creating a new one, then the market has changed, despite the fact that the market cannot change, but the system is based on something such that, say, when the price direction changes, the system does not take this into account . Sects are emerging. For example, "a sect of witnesses to the impossibility of profitable trading and the impossibility of predicting further price movements." In general, it all comes down to a trading approach, the market is always right!) But the market and trading on it is not a matter of faith, it is here on Earth, it was created by people and people participate in it, not Higher Forces, not aliens and events it is not random. That is why the market, price dynamics is predictable, can be analyzed and does not belong to the category of unknown and unknown. But so far, for many, these are not arguments, and “the sect of witnesses to market noise, chaos and randomness of the market” remains. It is possible to come to an understanding of the market and conscious trading - using, among other things, critical thinking. You don’t need to believe, not to believe, you need to question it, come to what there will be no doubt about after. I'll start with the most basic. Due to what does the price move, change? I think there is no doubt that the exchange, the market are created by man and have an Earthly origin, I will not delve into the history of the creation of the exchange, but this is a fact. This means that there is an algorithm for the functioning of the exchange, some kind of specific logic that was laid down by a person. There are no secrets here either, and any exchange has a description of how it functions. Moreover, we can independently check. Let's take any section of the price movement, any trading instrument and look at the order log - a log of completed transactions and orders. You can record the order flow and the order book with orders and view them in detail in the record. Using the principle of cause-and-effect relationships, we will accept the price change as a consequence, and we will look for the causes in the order flow. Yes, in order to understand the reason for the price change, using critical thinking, we must question every possible option, whether it be moon phases, oscillators, random walk, and so on. But we will not waste time on this, since we have an official version, namely, the actions of buyers and sellers lead to price changes, so we will check it. I will not record the order flow separately, everyone can check it on their trading instrument, different instruments, different exchanges, so that there are no thoughts that the principle described below occurs only on my instrument. So, in the order book we see limit orders. Above, mainly relative to the price of the last transaction - limit orders (orders) to sell, below, mainly relative to the last transaction price - limit orders (orders) to buy. The price with the lowest sell limit order is the best buy price for those who buy the market, that is, a market order, the price with the highest buy limit order is the best sell price for those who sell the market, that is, a market order. There is the last price of the transaction, it is displayed on the chart as the current price, and so, if you, me, or someone else decides to buy on the market, the price will shift to the price level where the best buy price is and if the number of contracts of our purchase does not exceeds the number of limit order contracts to sell at the best buy price, then the price change will stop at this level, if the number of market buy contracts exceeds the number of limit order contracts to sell at the best buy price - the price will move higher relative to the previous best buy price and the price of the best buy itself will move higher. The same principle applies to selling on the market, only with the opposite price change. Thus, we see confirmation that the price changes if one buys with a market order and sells with a market one, with limit orders being the counterparties of these market orders. It would seem that for some part of the traders this is not news, however, knowing the reasons for the price change, traders build their analysis not on the basis of this information, but on the basis of some mathematical indicators, news and other unnecessary information. There is an explanation for this and it sounds like this - “we must know the reasons for buying, and as a result, the price increase and the reasons for selling - the result of a price decrease, so we use indicators, figures, news and even astronomy, we use everything that will help to understand why participants buy and sell, and knowing the reason, we ourselves will do the same. And they seem to be right, but we decided to think critically, so we question whether we need to understand the reasons why people buy or sell? Firstly, in reality, there are a lot of reasons for making transactions, from a coin, up to fortune tellers, super volume indicators and fundamental analysis, but how will this help us? Suppose we have found the reasons and found out that they buy if the price is above the moving average of 200, and sell if the price is below it, instead of moving, you can use any indicator, any type of analysis, news, etc. But we know that the price will move in a direction only if the number of market orders is greater than the number of limit orders. Let's say the price is above the average (we substitute any Graal analysis) - we will buy. We bought, but the price does not go in our direction, how is it? But the fact is that we may not have the required number of contracts to parse limit orders for sale, that participant has, but we don’t, moreover, the rest of the participants are not in solidarity with our purchase and want to sell, they don’t are aware of our grail and we may still not have sufficient funds to support these sales with limit purchases. It would seem we know the reasons, but the result is not what we wanted. Secondly, even if we have enough funds to maintain the necessary price level and to create the necessary directional movement, what guarantees that there is no larger capital, which, as a counterparty, is gaining a position against us? There are no such guarantees, and basically this is exactly what will happen, for every big one there is even bigger one - who will eventually take the profit, in the end, there is only one final source of liquidity. Based on this, we conclude - we will buy above average (substitute any Graal analysis), if there is a large buyer! Exactly, but then we do not need an average (we substitute any Graal analysis). And there is no need to wonder what we are growing on, what we are falling on, because we always fall on the excess of the number of market orders to sell over the number of limit orders to buy, and we grow on the excess of the number of market orders to buy over the number of limit orders to sell, this is a constant, and the reasons for the excess of the number of market orders over limit orders are either diverse and subject to change, or we are simply not able to create the necessary conditions based on these reasons. As a result, there is nothing left but to analyze the actions of the market participants themselves, those who create movements, price changes, that is, the actions of buyers and sellers. But how to analyze them when there are many of these participants, and sometimes it is difficult to analyze the actions of oneself alone, and how do we penetrate into their thoughts in order to understand their intentions, current actions, we don’t even see them personally, and if robots also trade, then there’s no getting close at all, there are algorithms in there, who will reveal them to us? Firstly, it is not necessary to analyze the actions of an individual trader or each trader, it will not give anything anyway, you need to combine and bring all participants into 2 groups. In fact, the price changes, moves not due to one action, but due to collective actions united by one goal. One group - buyers, the second - sellers. There is nothing else on the market, we figured that out earlier. And secondly, you don’t need to be introduced anywhere. All people are the same. Yes, we differ in certain parameters, but our body functions the same way, the same applies to our psyche. Why exactly the psyche and why should it be analyzed? Because it is the mental processes, its functions that determine our actions, both current and future. I will not describe these processes in detail, it will take a lot of text, but you can get acquainted yourself - the brain, the psyche. Of course, here one can also say - “yes, we have combined into 2 groups - buyers and sellers, but these two groups of participants also have a lot of emotions that will incline them to action.” Yes, this is true, but we do not need the whole range of emotions. Also, we do not need to study as a psychologist to understand everything. Since we have determined that the functions of the psyche are the same for us, then to understand what emotions the market participants will have, it is enough to analyze our own. What do we experience after opening a trade? Yes, a lot of emotions, euphoria, hope, and others, but by opening a deal, it can have only one of two outcomes - either make a profit or lose some of the money. That is, based on this, there will be either a fear of losing, or a thirst for profit - greed. Fear and greed are the most basic emotions that a trader can experience while a trade is open. Moreover, as far as where the price is, relative to the price of opening a transaction, these emotions can and will change, fear for greed, greed for fear. Emotions are also grouped into collective ones. By the way, what about trading robots, because they have no emotions, otherwise the dominance of robots, which the participants of the “sect of witnesses of this dominance” tell us about, can generally nullify the possibility of forecasting. Any trading robot is created by a person, it contains a certain algorithm, yes, this algorithm partially relieves the trader of emotions that interfere with trading, but emotions will already be sewn into the algorithm itself. Let's say, if the robot goes to breakeven - fear of losses dominates here, tradeer is afraid of losing, so he will unwittingly hammer these emotions into the algorithm. Or let's say the size of the take will be large, or in relation to the risk, for some reason at least 1 to 3 is greed. I described only a part, it is clear there are more algorithms, but all of them will basically come down to these two emotions. There is an exception, but these robots, like traders, will analyze the actions of buyers and sellers and make transactions taking into account events that affect price changes. We link into a single system that part of the conclusions that we have received at the moment. The price is set in motion only by buyers, sellers, interacting with each other, therefore, to predict price changes, it is necessary to analyze their actions, specifically the analysis of collective buyers, which lead to an increase in the price and their counterparties - collective limit sellers, as well as collective sellers, which lead to lower prices and their counterparties - collective limit buyers. The next stage is to figure out how fear and greed will help predict the actions of buyers and sellers, and, accordingly, predict price changes. The fact is that any transaction has two stages - opening a transaction and closing a transaction. If the opening sets the price in motion, then closing the market also sets the price in motion, to close the purchase - you need to sell, to close the sale - you need to buy. Having deposited money into the market, the money does not disappear without a trace, does not evaporate, and everything does not end at the opening of a transaction. On the right side of the chart there will always be participants who opened positions, in the future, fear and greed will force them to close, thereby provoking a price change. Moreover, the price change at the close is a trigger for those who will open new deals. This is such a cycle. This is exactly what the main meaning of the analysis will be - where and how participants will perform actions based on emotions, how the price will change when performing these actions, what should happen with certain events. This is all ahead, but for now we will discuss such a moment. It may seem to the "sect of witnesses of light trading systems" that the approach is very complex - the psyche, emotions, buyers, sellers. It’s much easier to throw on a super grail indicator, and if it’s also in terms of volume, icebergs are there or only show the volume of “groats”, and if in addition to all this - “above the line - buy, below the line - sell”, then actually here it is - a miracle system. In principle, this is normal, the brain loves laziness and a person wants to get the maximum benefits with minimal energy expenditure. But the principle does not work that way, all the same, in order to receive benefits, it is necessary to expend energy at some stage. Even in dashes there is some kind of idea, which was reached through a certain logic, and in order to have an understanding of the principle of these dashes, you need to understand them. Moreover, having dealt with the principle and approaching it critically, we will be able to determine at the stage of acquaintance with it whether it has anything to do with the principles of the market and what is happening on it. Thus, we bypass the next "sect of witnesses of what is there." Therefore, any approach should be described as much as possible, what the idea is, what it is based on, not a dry technique. Well, in principle, to evaluate the system from a position - an easy system or a complex one - is not true. The system, first of all, should give an understanding of the reasons for what is happening at each point in the market. If only a part of price movements can be explained with the help of the system and / or for the explanation it is necessary to change the conditions of the system, then here it is clearly not a system, but an attempt to adjust to the result - a price change. Further, describing the system, it will become clear that the system does not need to be adjusted, ostensibly, to a change in the market. But you must admit, it is difficult to call a mechanism working if only separate parts are working in it and the result of the work of this mechanism is variable, at best. If the meaning is lightness, then it is easier to do nothing. By the way, what if a seemingly ordinary process is described in detail, say, driving a car? Talk about the fact that there are 3 pedals, and a person has 2 legs, that you need to look forward and in the rear-view mirrors and to the sides, evaluate the movement of other road users, turn the steering wheel and change gears, monitor the speed. And this is not a complete list of what you need to drive a car. Well, how, no one has any questions that it is unrealistically difficult and you need to look for simpler ways? Of course, you can look for simple ways, but this is unlikely to be a full-fledged driving. There is no point in the complexity or ease of the system if the system does not give an understanding of the cause-and-effect relationships at any point and there is no complexity or ease in principle, if there is an understanding, this is a common thing. The market is defined at every point, defined by the interactions of buyers, sellers. Since this is a fact, there is no need to limit yourself, justify yourself with “market noise”, the complexity of something in trading, and so on. First of all, I’ll figure out how to visualize buyers and sellers. So, I'll start with the fact that there are no bars, candles, time frames. All this o form, the form in which it is generally accepted to provide information about price dynamics. There are none for the market, but of course we see it all with our own eyes. But there is no bar analysis, candlestick, correct timeframe, which is better to analyze in comparison with others. There are successive buys, successive sells, which form price waves of buyers and sellers. We combine this sequence of actions into two groups and get the following - a consistent price movement up, until a change in the opposite direction - a wave of purchases, a consistent price movement down, until a change in the opposite direction - a wave of sales. A bar, a candle is a part of these waves, which is limited by the time of formation or other parameters, respectively, a separate bar, a candle does not give any complete picture. There is no correct TF either, there is a scale - this is a section of events that occurred as a result of the actions of market participants and which subsequently need to be analyzed to predict the next ones. It can be long-term, forming weeks, months, it can be short-term - intraday, it all depends on desires and comfort. There are different scales for trading, as there are different goals, opportunities for market participants, and thus they are divided into their own groups. They trade not a time frame, but a price, respectively defining goals and supporting them, these same scales are formed. And TF in its purest form is just a period of time during which the price fluctuated - truncated information, or hidden due to the long time of formation. The main purpose of speculative trading is to make a profit. The market is a closed system. There is no other money in the market, except for the money of the participants themselves, therefore, in order to make a profit, the other participant must receive a loss. Money flows from one trader to another and so consistently. Depending on which of the participants is losing, at the moment, all further analysis will depend. Visualize this process. By creating, say, an upward move, buyers create a visible buyer level. If the price falls below this level, buyers potentially lose money. The loss for them is the closing of the transaction below this level, for the first buyers, below the level of the opening of the transaction - in general. There are two ways to accept a loss - to close a deal in a losing market zone, when an unacceptable price level is reached, or to place a stop order in advance. It doesn't matter if it's pure stop orders or a market close, in fact it will be a market sell for the buyer, since closing a buy is selling. But to close a possible loss, you need to have some kind of algorithm. Main options: 1. Accept possible loss (stop/close) +/- 1 tick relative to the visible level. Basically, this is how beginners put their feet. Reasons not to lose much. What emotions? Fear. 2. Those who are more experienced and beaten by the market understand that this is nonsense, because there is a false breakout, you need to proceed from volatility so that prices do not break the stop by “random wandering”. Accordingly, the stop / close will be at some remote distance from the level. 3. As a percentage relative to the already created movement. In fact, no matter what algorithm for placing stops, closing a loss, due to collective actions that are due to the collective emotions of collective buyers, sellers, some algorithm will prevail, respectively, market orders will be concentrated in some area of prices, and in a certain area they will prevail relative to other price areas. Due to the high concentration of market orders in a certain area, when this price area is reached, a fairly large increase in volume appears in a short period of time, due to the simultaneous execution of market orders. "The sect of witnesses of a major player" will say - "this may be the opening of a deal by a major player." Yes, it can, so you need to consider the likelihood of this event. I will describe my view on this. Any surge in volume, increased volume, suggests 4 scenarios. The buyer and seller opened a position, the buyer and seller closed the position, the buyer opened, the seller closed and the buyer closed, the seller opened. Now you need to filter and logically parse each. On large timeframes, there can be all scenarios, since due to time, the volume accumulates, and therefore it is difficult to understand what actually happened there. Looking at a fairly high volume, in a short period of time, we can assume that hardly anyone opened a deal on the market. We understand why. In the glass, we see that the size of limit orders at each price level is clearly less than the value of this volume, that is, if someone opened a deal on the market, he clearly understood that due to excess liquidity, his entry into the market would provoke slippage . I do not think that a participant who can operate with such a volume will consciously worsen his deal. Such a participant is most likely organized, knows how to wait and will use the opportunities for a more comfortable entry. I come to the conclusion that the probability that such a volume opened a deal on the market is minimal. Now consider the probability of closing a deal on the market. Again, it is unlikely that with such money the participant will be so unrestrained and beat the closure on the market, since this, taking into account liquidity, will inevitably lead to the worst closing price of the transaction. But this concerns the closing of a positive transaction, but there are also negative ones. Here there is a high probability of this. Because no matter how you take into account liquidity, and in the case of a losing trade, it is no longer possible to influence the exit point, you need to exit at the prices that are. We still have the limit line entry and the limit line closing, not with each other, of course. Yes, the probability that with such a lot of money the participant is sustained, knows how to wait, knows how to determine the best price for entry / exit, increases. Thus, out of 4, 2 remain, which have a high probability. Namely, opening a deal with a limit, counterparty - closing by market (loss), closing by a limit, counterparty - closing by market (loss). Now it's getting easier. To sum up, with a higher probability, it is possible to determine who performed what actions on an increased volume on a smaller TF, since the loss is accepted, whether it be a stop, whether it is on the market, instantly, the majority will not close the loss in parts. Having logically analyzed the possibilities of big money, I come to the conclusion that in large volumes, with a higher probability, there is a loss on one side, more likely a stop, and the counterparty is a limit entry / exit. Of course, the volume is interpreted depending on the location and sequence of the location of the volume relative to the waves of buyers and sellers. It turns out that if one participant loses, then his counterparty earns. If the price went down and at the same time a sufficiently large volume appeared, then the seller earned, and the one who bought from him gave money. We connect all the information into a single, consistent system. In an upward buying wave, an increase in volume relative to the volume of the selling wave indicates that the buyer has made money and the seller has lost money, and upward momentum is formed. In a down selling wave, an increase in volume relative to the volume of the buying wave indicates that the seller has made money and the buyer has lost money, a downward momentum is formed. What does it give us from a practical point of view? Firstly, one part accepted the loss, but there are those who did not fix the loss, those who waited it out, there is also such a group, we remember ourselves in such situations. Accordingly, if the price returns to the area of their concentration, then in fear that the price may continue to move against their positions, they may close, and accordingly they will provoke the price movement further towards the impulse, those who have been waiting will use this trigger and also join the this movement, continuing it in the direction of the momentum. Secondly, after some participants have made a profit, others have lost, those who have received a loss will again try to earn. Everyone came to the market for this. People are afraid of being wrong, there is a good chance that after the momentum they will continue to trade against the momentum. Well, the price after the impulse becomes attractive from the position of expensive / cheap. All this creates a corrective movement against momentum. And if the volume does not increase in this corrective movement, then these participants are not able to earn, respectively, at the expense of these participants, their counterparty will earn in the future. If the overstayers do not exit or there are none, then there will be no movement in the direction of the impulse, there will be a deep correction in order to take money from the opposite side. If money is not taken away, then after a deep correction they will be taken away from those who created this correction. For "sects of witnesses of trends, flats" - there are none. From the point of view of the goals of speculative trading, there is an impulse - a price movement in which the volume increases, and the increase indicates that one side loses, the other earns. And there is a correction, which can be deep and shallow - the price movement in which the volume does not increase, respectively, these participants do not earn on this movement, but are those at the expense of whom the counterparty will earn. It can be said that a trend is successive impulses in one direction, and a flat is a protracted correction or an alternation of opposite impulses, a work of a smaller scale inside the main one. But what will a trend give us, a flat in the classical sense? Nothing. Therefore, there is no point in trends and flats. The market is a correction - an impulse, an impulse - a correction, in the definition that is above, which corresponds to the meaning of speculative trading. Let me introduce the concept of effort. Effort (buyer/seller) is the dominance of one of the participants (buyer or seller). It looks like this, let's say a group of buyers bought in a certain price range, but the seller turned out to be stronger and the price shifted lower. Due to the fact that the price became cheaper, the participants bought again. If these participants buy in such a way that the price goes beyond the range of previous buyers, this indicates the strength of the buyer. That is, before The previous buyer does not exit, because if he exited in fear, then in that area we would see sales, and if there are none, then the buyer, the group of buyers, shows strength. This is just force, that is, control of the situation, the effort does not mean that they are taking money away. We assemble into a single, sequential system. We find the last two impulses. Two, to find the place where the last actions of buyers/sellers begin and end, because the end is the beginning of the next one. The last action is necessary, since the probability that participants can remain in this price range is higher. All other ranges where battles unfolded earlier are no longer relevant, there are no participants there, or the part that belongs to a larger scale remains. All activity of the participants will unfold relative to the last range of struggle between buyers and sellers. We have a coordinate system - a frame - a price range, which includes waves of buyers, sellers, located between the last two impulses, which has extreme points - a minimum, a maximum. We collect everything in a single consistent system. 1 - So, with respect to the last frame, after the impulse, we begin to track the effort. Effort will lead to correction. The reasons why participants will create an effort is a speculative desire to buy / sell cheaper / more expensive, because after the impulse, everything that is above / below the maximum / minimum of the frame is expensive / cheap for participants. There was an effort, in the price area of the corresponding position is expensive / cheap - you can open a deal. Sooner or later, an effort will definitely come, since one side will run out of money to develop its direction, and the opposite will take advantage of this by creating its own effort. We just have to wait. The participants who created the effort and those who will connect to them create a corrective movement at the initial stage in order to make money on it, to take money from the opposite side. If this happens, we will see the opposite impulse. Then we return to point (1) and continue to track the effort, but the opposite side. If there is no impulse, scenario (2) occurs. 2 - Participants who did not take a loss, if any, their open positions remain inside the frame. With a corrective movement inside the frame, the price approaches the concentration range of these participants. If fear prevails over greed among these participants, these participants will begin to close their positions, these actions will set the price in motion against the correction, in the direction of the impulse, the rest of the participants will receive a trigger to open deals in the direction of the impulse. We will receive a signal in the form of effort and will be able to consciously close the previous trade and consciously open the opposite one. If greed prevails, then we will see a continuation of the corrective movement and keep the deal based on paragraph (1) . 3 - There are no cheap/expensive prices inside the framework, they are outside the extremes of the framework. That is, if there is no trigger inside the framework in the person of those participants who will close deals, then the trigger will appear behind the extremum of the framework, in the person of those participants who will have a speculative desire to open a deal expensive/cheap. Beyond the extremes, the concentration of these participants increases. When this happens, we will again see the effort, but beyond the frame extremum. We do not completely exclude the opening of positions inside the frame, but if it happens, then the effort will tell us about it. And if scenario (2) has not developed and moved to (3), then we already close the deal from scenario (1) on the basis of scenario (3) and consciously open the opposite one, in the direction of the impulse. Those participants who created the corrective movement and failed to make money on it, because of the strength, the control of the opposite side, will eventually lose, because you do not earn, so they earn at the expense of you. We accompany the transaction according to scenario (2) or (3) until a new impulse appears in the direction of the previous one, and when a new impulse appears, we proceed to scenario (1). If, during a deep correction and the price goes beyond the extremum (if some of the participants inside the frame did not fix profits, there are some or from those who entered the frame again, but did not affect the price dynamics), an impulse appears - go to point (1). And it's so cyclical. To summarize, all that we see on the chart is either scenario (1)-(1) - from impulse to impulse, or (1)-(2)-(1) - impulse - usual correction - impulse, or (1)-( 3)-(1) - impulse - deep correction - impulse. No other processes, scenarios, based on a speculative point of view, and now almost any market is speculative, the market does not. 4 - There are additional, more protracted manipulations, say, after a correction, the price moves towards the impulse, but the impulse is not confirmed, then this movement will be classified as a correctional one, with all the consequences, but this scenario is a variation of one of the three main ones - impulse - correction ( which can and should also be cut off by transactions) – momentum. Understanding what wave we are trading in - we are trading not expectations, but events, the market, based on understanding market processes through the analysis of collective actions of participants, collective transactions. The end of one scenario is the beginning of a new scenario. Completion, closing of the transaction is equal to the opening of the next transaction. And in addition to risk control, it is possible to control the primary parameters of the exit-entry, entry-exit control system. Trading levels are determined by the concentration of market participants' actions, based on the scenarios described above. You can believe in it, you can not believe it, but if you open any trading instrument and apply the described scenarios, then we will not see any other scenarios, we will not see gaps in the form of a misunderstanding of the reasons, we will not see “market noise”, and these scenarios occur sequentially, continuously. And the fact that “a sect of witnesses of working indicators and other evidence”, not directly related to the analysis of the actions of market participants, sees at some point the development of their indicators is a coincidence with one of the scenarios described above. Precisely because the signal of "indicators and co" does not directly give an idea about the participants, the main emphasis in such approaches is on mathematics, statistics, risk / profit ratio. And it is mathematics in the form of risk / profit ratio that can pull out such approaches, and then with periodic adjustments of parameters, when volatility and liquidity change. If "indicators and co" gave an advantage and an idea of what is happening on the market, there would be no need for a risk / profit ratio, since they would give a reverse signal, after working out which one could make a reverse entry - a reverse of the previous transaction. And if, after entering a trade, the exit from it is shifted to the risk / profit ratio, that is, waiting, and not waiting for a signal, this indicates that the system actually has no conditions either for opening a transaction or for closing. Of course, there are some conditions, but the principle is something like this - "I'll take an umbrella, because the windows are plastic." Let me give you an example, the system gives a signal to buy, the trader bought. What is the trader waiting for? If a trader is not waiting for a reverse signal, but for a purchase, a reverse signal is a sale, then he does not trust his sell signal, and if so, he should not sell in the future. And if you sell and do not use a buy signal to close the sale, then there is no confidence in the buy signal. And if he trusts, why does he need a ratio, statistics? The purchase is closed with a sale, the sale is closed with a purchase, there are conditions for both selling and buying in the system - trade the system. It turns out the gaps in the analysis are closed by mathematics. The trader simply shifts responsibility to something that is not even an element of the process. Yes, mathematics can pull it out at a distance, but, at a minimum, you will have to change the parameters when volatility changes. But when applying methods of analysis that do not correspond to the analyzed area, the analysis becomes more complicated, the quality deteriorates, discomfort appears, discomfort leads to negative emotions that affect the result, and so on. It is difficult to imagine that, say, in order to cross the road, a pedestrian would collect traffic statistics, calculate the probability and risks and shift all responsibility to mathematics, and not use the means of informing or not be convinced firsthand about the appearance of conditions for crossing. And in trading, all this is used, hence the “sects of witnesses of a complex market, non-working systems, a changing market” and others. As for the scale, we must understand that market participants have different goals, different capital, hence there are different scales in which different participants are located in terms of holding time, position accumulation, which can be analyzed. You can synthesize several scales, you can analyze intraday, longer-term ones. Scale - the trader's choice based on their preferences. And participants of different scales are always present. As for large TFs. They can also be used, but due to the accumulation over time, the volume will be mixed. As a result, the concept of large purchases / sales remains. It is also applied successfully, but with certain logic accompanying this concept. Namely, the main emphasis will be directed to the efforts of one of the parties. Well, in order to completely complete the description of the approach, the system, the topic of take / stop remains. Based on the fact that closing a deal is an entry in the opposite direction, the take is not fixed, and so is the protective stop. Stop should be placed behind the level preceding the entry level, which is above / below the level relative to which the transaction is opened. This is how we get rid of possible false breakouts, and if the breakout turns into an impulse, then we will have a backlash in order to turn it over in time and prevent a complete loss. At the same time, the stop level is not large, not small, it corresponds to the current market volatility and makes it possible to avoid its execution with full involvement and the absence of force majeure situations. Yes, a protective stop is also needed for this approach. Wherever the result depends not only on you, you need to have additional protection . The human factor can work, get distracted, not have time to make the necessary decision, rarely, but a market participant’s mistake with the position volume can lead to a sharp price shift, in general, in case of such situations, you need to have a protective stop order. In most cases, the trader must react to the conditions before the stop is triggered.

Conscious trading. Speculative trading
- Thread starter Mikhail Mercantilist
- Start date
- Watchers 4
You are using an out of date browser. It may not display this or other websites correctly.
You should upgrade or use an alternative browser.
You should upgrade or use an alternative browser.
1st Trading week 3.10-7.10.2022. Trading results, within trading signals.
Trading, within the framework of trading signals, was carried out on 6 instruments - ES, NQ, 6E, 6B, CL, GC. The maximum number of contracts for 1 position is 2 contracts. All transactions within one day, that is, opening and closing within a day, without transferring the position through clearing. Traded, mainly, the main direction, which forms the framework of the trading day + correction before or after this directional movement. As a result, 1-2 transactions are obtained within the framework of the main intraday movement. Screenshots with deals are randomly selected to show how it looks.
Explanation of the results of trading signals, plans.
The high value of transactions closed with a loss is due to the fact that he closed these transactions with his hands, and not by stop. It can be seen on the yield curve that in the places of the account strait, there is a series of two losing trades. It has to do with the technical side. When I place two orders to open a deal, I do it within OCO orders, then when the second one is triggered, the stop order is canceled, which should protect the position, as a result, when I'm not at the monitor, no one closes the deal, because the stop order, within the OCO, canceled. If you remove OCO, it will be the other way around - there will be a stop and limit target, which is also bad, since the limit target can work when there are no positions anymore. Through the ATM strategy, I don't understand why I don't see a potential stop order and target order, which I can adjust according to my conditions, from the chart. As a result, since I used the approach - I opened a deal, placed orders and do not interfere in the process, I had to close deals with hands with a much larger loss than planned based on the stop level. Maybe I'm doing something wrong in NT8, or I'm too used to MultiCharts, where this is not a problem. Who is well versed in NT8 with ATM strategy, OCO orders - write how you solve this problem with orders (stop and target)?
Set up sending a screenshot with orders and positions from NT8 to Telegram. Perhaps it will be necessary to send text messages on an event, for example - such and such a position is open, with such and such volume, and so on. But the condition of sending a message on an event is complicated by the fact that orders must be sent through a strategy, which for me is a different level in understanding. Who has experience in sending messages from NT8 to Telegram, no matter how, by event, or by other conditions - write, help will be counted)
In general, at the moment, there is an opportunity to use my approach, within the framework of trading signals, and with a fairly good result. We succeeded in adapting the method to trading signals. The next task is to deal with orders, sending text messages from NT8 to Telegram. Plus, for those who voted for other instruments and a larger scale, with the transfer of positions through clearing - a format in the form of recommendations, without working out transactions on my part.
These are not critical tasks. Further, important tasks - I plan to create conditions for users, with clarifying conditions for the entry point. As part of working out the main direction of the day, I don’t specify the entry, it’s just that there is a working range on the highest scale and I work with its boundaries, since for all 6 instruments to wait for the ideal entry point on each means to bind yourself for the whole day. Accordingly, for those who will use the signals, you need to give a setup that they will use for an ideal entry point at the level I indicated - the range. The setup will reduce, reduce to a logical minimum the potential size of the stop. Plus, for more active traders, who will not be satisfied with only the main movement and want to diversify transactions, I plan to give a setup that will allow, within the main direction, to make additional transactions.After solving the maintasks, the trading signals service will be translated for testing by a wide audience.

.jpg")
.jpg")
.jpg")
.jpg")

.jpg")
.jpg")

2nd Trading week 10.10-14.10.2022. Trading results, within trading signals.
Trading, within the framework of trading signals, was carried out on 6 instruments - ES, NQ, 6E, 6B, CL, GC. The maximum number of contracts for 1 position is 2 contracts. All transactions within one day, that is, opening and closing positions within a day. Traded, mainly, the main direction, which forms the framework of the trading day + correction before or after this directional movement. As a result, 1-2 transactions are obtained within the framework of the main intraday movement. Screens with deals are presented as one position for each instrument from the list, for an indicator of how it looks. Aggregate profit is shown in ticks and currency.
Detailed explanations, analysis and further plans. Research into the previously announced plans led to the need to reinstall NT8, resulting in account statistics without last week. Otherwise, everything is on the same level.
.jpg")
.jpg")

.jpg")
.jpg")

.jpg")
.jpg")

Trading, within the framework of trading signals, was carried out on 6 instruments - ES, NQ, 6E, 6B, CL, GC. The maximum number of contracts for 1 position is 2 contracts. All transactions within one day, that is, opening and closing within a day, without transferring the position through clearing. Traded, mainly, the main direction, which forms the framework of the trading day + correction before or after this directional movement. As a result, 1-2 transactions are obtained within the framework of the main intraday movement. Screenshots with deals are randomly selected to show how it looks.
Explanation of the results of trading signals, plans.
The high value of transactions closed with a loss is due to the fact that he closed these transactions with his hands, and not by stop. It can be seen on the yield curve that in the places of the account strait, there is a series of two losing trades. It has to do with the technical side. When I place two orders to open a deal, I do it within OCO orders, then when the second one is triggered, the stop order is canceled, which should protect the position, as a result, when I'm not at the monitor, no one closes the deal, because the stop order, within the OCO, canceled. If you remove OCO, it will be the other way around - there will be a stop and limit target, which is also bad, since the limit target can work when there are no positions anymore. Through the ATM strategy, I don't understand why I don't see a potential stop order and target order, which I can adjust according to my conditions, from the chart. As a result, since I used the approach - I opened a deal, placed orders and do not interfere in the process, I had to close deals with hands with a much larger loss than planned based on the stop level. Maybe I'm doing something wrong in NT8, or I'm too used to MultiCharts, where this is not a problem. Who is well versed in NT8 with ATM strategy, OCO orders - write how you solve this problem with orders (stop and target)?
Set up sending a screenshot with orders and positions from NT8 to Telegram. Perhaps it will be necessary to send text messages on an event, for example - such and such a position is open, with such and such volume, and so on. But the condition of sending a message on an event is complicated by the fact that orders must be sent through a strategy, which for me is a different level in understanding. Who has experience in sending messages from NT8 to Telegram, no matter how, by event, or by other conditions - write, help will be counted)
In general, at the moment, there is an opportunity to use my approach, within the framework of trading signals, and with a fairly good result. We succeeded in adapting the method to trading signals. The next task is to deal with orders, sending text messages from NT8 to Telegram. Plus, for those who voted for other instruments and a larger scale, with the transfer of positions through clearing - a format in the form of recommendations, without working out transactions on my part.
These are not critical tasks. Further, important tasks - I plan to create conditions for users, with clarifying conditions for the entry point. As part of working out the main direction of the day, I don’t specify the entry, it’s just that there is a working range on the highest scale and I work with its boundaries, since for all 6 instruments to wait for the ideal entry point on each means to bind yourself for the whole day. Accordingly, for those who will use the signals, you need to give a setup that they will use for an ideal entry point at the level I indicated - the range. The setup will reduce, reduce to a logical minimum the potential size of the stop. Plus, for more active traders, who will not be satisfied with only the main movement and want to diversify transactions, I plan to give a setup that will allow, within the main direction, to make additional transactions.After solving the maintasks, the trading signals service will be translated for testing by a wide audience.
Post automatically merged:
2nd Trading week 10.10-14.10.2022. Trading results, within trading signals.
Trading, within the framework of trading signals, was carried out on 6 instruments - ES, NQ, 6E, 6B, CL, GC. The maximum number of contracts for 1 position is 2 contracts. All transactions within one day, that is, opening and closing positions within a day. Traded, mainly, the main direction, which forms the framework of the trading day + correction before or after this directional movement. As a result, 1-2 transactions are obtained within the framework of the main intraday movement. Screens with deals are presented as one position for each instrument from the list, for an indicator of how it looks. Aggregate profit is shown in ticks and currency.
Detailed explanations, analysis and further plans. Research into the previously announced plans led to the need to reinstall NT8, resulting in account statistics without last week. Otherwise, everything is on the same level.
3rd Trading Week 10/17-21/10/2022 + general statistics from 10/10/21/10/2022. Trading results, within trading signals.
Trading, within the framework of trading signals, was carried out on 6 instruments - ES, NQ, 6E, 6B, CL, GC. The maximum number of contracts for 1 position is 2 contracts. All transactions within one day, that is, opening and closing positions within a day. Traded, mainly, the main direction, which forms the framework of the trading day + correction before or after this directional movement. As a result, 1-2 transactions are obtained within the framework of the main intraday movement. Screens with deals are presented as one position for each instrument from the list, for an indicator of how it looks. Aggregate profit is shown in ticks and currency.


Trading, within the framework of trading signals, was carried out on 6 instruments - ES, NQ, 6E, 6B, CL, GC. The maximum number of contracts for 1 position is 2 contracts. All transactions within one day, that is, opening and closing positions within a day. Traded, mainly, the main direction, which forms the framework of the trading day + correction before or after this directional movement. As a result, 1-2 transactions are obtained within the framework of the main intraday movement. Screens with deals are presented as one position for each instrument from the list, for an indicator of how it looks. Aggregate profit is shown in ticks and currency.
4th Trading week 24.10-28.10.2022 + general statistics from 10.10-28.10.2022. Trading results, within trading signals.
Trading, within the framework of trading signals, was carried out on 6 instruments - ES, NQ, 6E, 6B, CL, GC. The maximum number of contracts for 1 position is 2 contracts. All transactions within one day, that is, opening and closing positions within a day. Traded, mainly, the main direction, which forms the framework of the trading day + correction before or after this directional movement. As a result, 1-2 transactions are obtained within the framework of the main intraday movement. Screens with deals are presented as one position for each instrument from the list, for an indicator of how it looks. Aggregate profit is shown in ticks and currency.


Trading, within the framework of trading signals, was carried out on 6 instruments - ES, NQ, 6E, 6B, CL, GC. The maximum number of contracts for 1 position is 2 contracts. All transactions within one day, that is, opening and closing positions within a day. Traded, mainly, the main direction, which forms the framework of the trading day + correction before or after this directional movement. As a result, 1-2 transactions are obtained within the framework of the main intraday movement. Screens with deals are presented as one position for each instrument from the list, for an indicator of how it looks. Aggregate profit is shown in ticks and currency.
Detailed, very detailed, even to the point of nausea, detailed analysis of transactions, as a visualization of the described approach.
take care of your eyes!Wall of text offended my eyeballs
Post automatically merged:
5th trading week 10/31-11/4/2022 + general statistics from 10/10-11/4/2022. Trading results, within trading signals.
Trading, within the framework of trading signals, was carried out on 6 instruments - ES, NQ, 6E, 6B, CL, GC. The maximum number of contracts for 1 position is 2 contracts. All transactions within one day, that is, opening and closing positions within a day. Traded, mainly, the main direction, which forms the framework of the trading day + correction before or after this directional movement. As a result, 1-2 transactions are obtained within the framework of the main intraday movement. Screens with deals are presented as one position for each instrument from the list, for an indicator of how it looks. Aggregate profit is shown in ticks and currency.


What is TL;DR?The first post is indeed hard to navigate, could you perhaps give a TL;DR on your thoughts?
"too long; didn't read", it basically means a shorter summary of your post that contains the most important points you want to make.What is TL;DR?
Trading. Student learning outcomes. Transactions of several students are combined into one post.
.jpg")
.jpg")
.jpg")
.jpg")

.jpg")
.jpg")
.jpg")


Trading. 6th Trading week 20.02-24.02.2023 Trading results, as part of trading signals Trading, within the framework of trading signals, was carried out on 6 instruments - ES, NQ, 6E, 6B, CL, GC. The maximum number of contracts for 1 position is 2 contracts. All transactions within one day, that is, opening and closing positions within a day. Traded, mainly, the main direction, which forms the framework of the trading day + correction before or after this directional movement. As a result, 1-2 transactions are obtained within the framework of the main intraday movement. Screens with deals are presented as one position for each instrument from the list, for an indicator of how it looks. Aggregate profit is shown in ticks and currency.


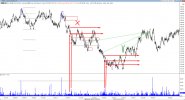
From point 3, the scenarios described in the article My approach to speculative trading. Conscious trading. We know part 2 - when the price goes beyond the frame, the price becomes attractive, in this case, for buyers. Accordingly, we will look for a purchase. The main question is "where?". It is clear that in a place where the buyer will show strength, but there are times when the strength is aggressive, but not complete. In order for the effort to be complete, it is necessary that the corresponding volume pushed the price out of the volume range, which previously pushed the price in the opposite direction. ❌ we do not see the full effort, there is an aggressive one that can be traded, but you need to understand that you need to find a point for sale nearby for this purchase. ✅ we see the full effort, respectively, we can count on more global and long-term purchases. Who knew, he will consolidate his knowledge, who did not know - received new information and will successfully apply, and with the student, in class, we will analyze in detail and correct the error.


Attachments
The results of the practical application by students (traders using this method) of the previously described method.
The results are posted publicly as a demonstration of the effectiveness of this method, with the aim of bringing together traders with similar views and attitudes towards the market through discussion and application of this approach.


The results are posted publicly as a demonstration of the effectiveness of this method, with the aim of bringing together traders with similar views and attitudes towards the market through discussion and application of this approach.
Trading. Answering questions about trading and about
Rubric question - answer. I answer questions about trading and more.
Answering questions on the practical application of the method.
Rubric question - answer. I answer questions about trading and more.
Answering questions on the practical application of the method.
Trading. Answering questions about trading and about
Rubric question - answer. I answer questions about trading and more.
Q: Why a second chart and not a tick chart? The tick chart is not informative.
Michael (Mercantilist)
A: Purely practically look. You have a minute and you described it like this, and now describe it for 10 seconds. There is a difference, right? Since the minute hid the details of the price and volume movement and you could not see them on the minute. If you go deep into ticks, you will see individual trades and their volume, which is not true for stops. Example, there are stops of 100 contracts in total. Stops have been triggered, it is 1 bar per second, and in ticks it can be 1 and 10 and 100 bars.
Yes, a tick is the smallest price movement, but if we are talking about a tick chart, then a tick chart is built not when the price changes, but when a trade appears. A trade has appeared - a new bar has been drawn, if we consider 1 tick.
Well, imagine the situation, 100 stop contracts, in total, but they were set not at the same price, but in a range, and each contract belongs to different traders. The counterparty is also not one and the limits are also scattered. When such an area of stops is triggered, you will see not one trade, but a series. Like 100 trades in a row on 1 contract, and other variations. In the end, these were stops, but you won’t notice this on a tick chart, since there are 100 on one contract.
Well, I described the situation. Where does the increased volume come from, if from the side of the stops each for 1 contract and from the side of the counterparty each for 1 contract.
Yes, I simulated an extreme situation to illustrate the fact that the tick chart does not provide the necessary information.
Okay, imagine stops for a total of 100 contracts, the size of the stops is different for everyone, but in total in the area of 100. They worked. The one that has more stops, say 35, will stand out. You see this bar with 35 contracts and you think that these are stops, but the stops are 100 contracts in total. As a result, you received less information, because the tick chart shows a trade, that is, a trade, one trade, and there may be more than one trade in the stops.
Trading. Rubric question - answer. I answer questions about trading and more.
Q: I would like to clarify what "stops have worked" means? How can we possibly know this? Or maybe it was someone who also entered with a limit, but there were no stops at all. And again, for each transaction there is a counterparty.
Michael (Mercantilist)
A: Any volume is a buy and sell. More to come. What can be in volume from the entry/exit position? 1. The buyer opens, the seller closes. 2. The buyer closes, the seller opens. 3. Both buyer and seller opened. 4. Both buyer and seller closed. Whose entry/exit are you interested in?)) In principle, it is impossible to determine who entered and who left, the exchange does not broadcast such information. It remains to be written logically. I understand for myself that, based on the fact that movements in the market replace each other, ascending is replaced by descending and vice versa, even if the volume was an exit, then after it there will be an entry volume and there will be movement, the price will not freeze forever. And accordingly, we can draw conclusions based on the price reaction. Well, the concept is a sharp surge in the volume of this foot.
I will describe my view on this. Any surge in volume, increased volume, suggests 4 scenarios. The buyer and seller opened a position, the buyer and seller closed the position, the buyer opened, the seller closed and the buyer closed, the seller opened. Now you need to filter and logically parse each. On large timeframes, there can be all scenarios, since due to time, the volume accumulates, and therefore it is difficult to understand what actually happened there. Therefore, we switch to a second TF, it is easier there. Looking at a fairly high volume, in a short period of time, we can assume that hardly anyone opened a deal on the market. We understand why. In the DOM, we see that the size of limit orders at each price level is clearly less than the value of this volume, that is, if someone opened a deal on the market, he clearly understood that due to excess liquidity, his entry into the market would provoke slippage. I do not think that a participant who can operate with such a volume will consciously worsen his deal. Such a participant is most likely organized, knows how to wait and will use the opportunities for a more comfortable entry. I come to the conclusion that the probability that such a volume opened a deal on the market is minimal. Now consider the probability of closing a deal on the market. Again, it is unlikely that with such money the participant will be so unrestrained and beat the closure on the market, since this, taking into account liquidity, will inevitably lead to the worst closing price of the transaction. But this concerns the closing of a positive transaction, but there are also negative ones. Here there is a high probability of this. Because no matter how you take into account liquidity, and in the case of a losing trade, it is no longer possible to influence the exit point, you need to exit at the prices that are. We still have a limit-limit entry and a limit-limit close. Yes, the probability that with such a lot of money the participant is sustained, knows how to wait, knows how to determine the best price for entry / exit, increases. Thus, out of 4, 2 remain, which have a high probability. Namely, opening a deal with a limit, counterparty - closing by market (loss), closing by a limit, counterparty - closing by market (loss). Now it's getting easier. If both are closed, then this is an empty volume, after it a new game begins, the participants reopen deals. If one closed, the other opened, then we can expect a reaction to this volume. In the direction of the volume, we determine which of the participants performed which actions. And depending on this information, we can build further analysis.
To summarize, it is more likely to determine who performed what actions on an increased volume on a second TF. Having logically analyzed the possibilities of big money, I come to the conclusion that in such volumes, it is more likely that there is a loss on one side, more likely stops, and the counterparty has a limit entry / exit. From all this, further analysis is built.
Trading. Rubric question - answer. I answer questions about trading and more.
Q: The spot is primary, the futures price is formed according to the formula.
Michael (Mercantilist)
A: So you are saying that the price moves because of the existence of the spot market, but not because of the actions of buyers / sellers. Right? The price on the future does not move due to the presence of a formula) apparently you are obsessed with that statement, or rather, you do not agree that the futures move the spot. So he doesn't move it. That's me and all of us who trade futures anyway at the spot price when making a deal. But by making them, we influence the price of the future. If at the same time we correlate the price, then arbitrageurs will bring it into line and influence the dynamics of the future. And we will see this change in price, volume, and we will build further forecasts regarding these changes. Even if your theory is correct and the future follows the spot, this does not negate the fact that by analyzing the future, you can trade it without spot analysis. After all, if the price changes on the spot, it also changes on the future, right? And the price can change only with the actions of buyers / sellers. So someone must, must, repeat the action on the future. We see these actions and can analyze them. Not proof?) Another such moment. Like how can smaller volumes move the price? I will answer with an example. You want to buy 1 contract, I want to sell 1. There are no other willing people on the instrument. But you want to buy at any price, and the last one was 10. And I want to sell only at a price of 100. As a result, when buying, we will be brought together at a price of 100. And the last price was 10. As a result, the price will shift as much as 90 points with a volume of 1 contract. One, not a million. By the way, I can show the facts that the price of a future changes precisely because of the trade, that is, the information of the buyer with the seller. It's a fact. Is there any evidence that because of the formula? Hardly, because one cancels the other. If you claim, above it is, that the price does not move at the expense of buyers of sellers, then in fact, in your theory, they do not exist at all, let alone cancel) It can work like that. So I analyze where there is more volume, where it is directed. There is volume on the future. Look, many are trying to understand the reasons for buying, selling by large players. I don't think it makes sense. Let him at least orientate himself by the stars, at least by the spot. Our task is to see who buys or sells, in what place and join it. Well, you know that he is looking at the spot. Do you think you can do the same again? Hardly. Therefore, it is easier not to bother with the reasons for their purchases and sales, but to join the one who is stronger at the moment and is able to ensure price movement in a certain direction.
Trading. Answering questions about trading and about (post 5)
Rubric question - answer. I answer questions about trading and more.
Q: My opinion is that MM on futures leads the price with an eye to the spot market or some other underlying asset or a combination of them, as in indices, this already depends on the instrument. To be honest, I don't know much about this subject. But if, for example, we take sp500 and look at the monthly chart, we will see a systematic growth, we immediately remember what the index is based on - these are the shares of the most profitable companies and selected blah blah blah according to some criteria ... Naturally, the sip will be go up and MM will purposefully "pick a low price" (c)). Another thing is that in order to be able to push the price to a new global target level, liquidity is needed. And in the campaign for this liquidity, the price can dive hundreds of points down. Those who watched the price for a long time could see such a situation - the price, by all indications, is about to go up, but at some point the movement fizzles out and the price falls below the previous level, this is precisely the lack of fuel in order to "break through next ceiling. Just recently, the historical high was updated on the sip and I watched the market that day and saw how difficult the market was for intraday traders... So I agree about global goals, but at the micro level of the market - where there is MM and high liquidity - the price goes where the majority will lose, this is the only way to maintain such liquidity of the instrument and systematically achieve your global goals.
Michael (Mercantilist)
A: Okay, futures need to follow the underlying instrument. If the underlying goes up, then the futures should go up as well. We know that the price is driven by active market buyers and limit sellers. For futures prices to rise to match the base price, market buyers are needed. All right? I don't think there is any controversy about this. So, if there really is a goal to maintain the correlation, someone will have to really buy on the market, without this there is no way. Let this function be performed by MM, arbitrageurs and others, but in the end it is a buyer who, in accordance with the current liquidity, poured in for this the amount of volume that was required. This buyer left a trace in some range in the form of open transactions (volume). His counterpart also left a trail. The volume that is injected for correlation with the base one will have to be closed at some point, right? It is impossible to open a deal and leave the market without closing it. Closing the previously accumulated volume will affect the price? Of course, how the discovery influenced.
What do we end up with? The price of the future was influenced by those buyers and the amount of volume that opened deals on the future and the volume that corresponded to the liquidity that was. I think it is obvious that the volumes, transactions of the underlying instrument did not directly affect the price of the future in any way. But what about the underlying asset, what is its impact, if transactions were made on the future and it is obvious that transactions on the underlying did not change the price of the future in any way? The underlying instrument acted as an "indicator" following the price of which transactions were made on the future.
Therefore, I think that the theory that futures volumes do not affect the price, but only the volumes of the underlying instrument, since there are more volumes on the underlying instrument (such a theory, right?) Is not entirely correct. Spot leads futures? No, the participants who are present at the future conduct the futures. Futures following the spot market? Yes, it can, if future participants take the price of the underlying instrument as an indicator, look back at it.
By the way, this theory (spot volumes are larger, that's why they conduct futures) resembles the theory "if you know the system by which a large player trades, then I will tear the market, it is important to know how a large player trades." The similarity is this. Suppose we know the system, let it be a banal moving one, not the point. Here the price suits it, and a major player gains a position, creates conditions under which, after a major player sets, the other participants move the price in the right direction. Great! We start to apply, and? And here is the problem, we also open a trade on the moving average, but the price goes against it. This is because we cannot create the same conditions for the rest of the participants to open in the right direction, because we are limited in funds. The key point for us will not be the system used by a major player, but the very participation of this player as a buyer or seller. That is, the system of a major can be compared with the price of the underlying instrument, just an indicator, and the price movement will depend not on the price of the underlying asset and not on the system of a major player, but on who actually buys/sells. Accordingly, the analysis of the real actions of the participants gives an understanding of what is happening, since they form the price of a particular instrument by their actions, transactions and volume, and on what they base their decision on sales / purchases, whether it is the moving price or the price of the underlying instrument or the same phases of the moon do not so important.
Similar threads
- Replies
- 0
- Views
- 2K
- Replies
- 0
- Views
- 4K
- Replies
- 3
- Views
- 3K
- Replies
- 0
- Views
- 2K
- Replies
- 22
- Views
- 13K