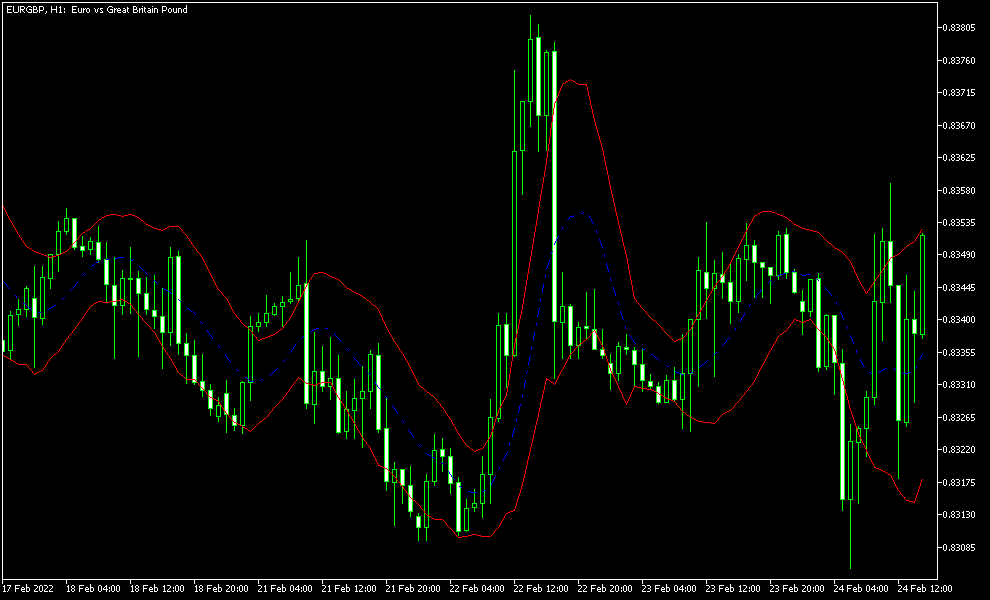
Keltner Channel
Keltner Channel (MetaTrader indicator) — is a classical technical analysis indicator developed by Chester W. Keltner in 1960. The indicator is somewhat similar to the Bollinger Bands and Envelopes. It uses three plot lines: the middle line is the 10-day simple moving average applied to the typical price ((high + low + close) / 3), the upper and the lower bands are produced by adding and subtracting the moving average of the daily price range (High and Low difference) from the middle line. This way, a volatility-based channel is built. In this version of the indicator you can modify all the parameters of the MA. The indicator is available both for MT4 and MT5 versions of the platform.
Calculation rules
To calculate Keltner channel values, you need High, Low, and Close data of your timeseries and some way to compute a simple moving average:


where, SMA10 is a simple moving average of ten periods.
Fortunately, in MetaTrader, there is no need to do these calculations manually. The indicator that you can download here does them automatically.
Input parameters
- MA_Period (default = 10) — the period of the moving average (middle line).
- Mode_MA (default = MODE_SMA) — the mode of the moving average (middle line).
- Price_Type (default = PRICE_TYPICAL) — the applied price of the moving average (middle line).
Example and strategy

The classical strategy with this indicator is to go long when the price closes above the upper band and to go short when it closes below the lower band. It seems to be a rather viable entry system. The exits can be based on three components: a very conservative stop-loss (as you see on the chart, false signals are not uncommon), some rather distant take-profit, and a cross with the middle line. Some traders also suggest using other indicators for confirmation.
Mathematically, the channel represents the bands weighted more heavily towards the upper side during uptrends and towards the lower side during the downtrends. This means that the upper line is less likely to be broken in an already established rising trend. The vice versa is true for an already established downtrend.
Download (ver. 1.01, 2022-03-08)
Keltner Channel for MetaTrader 4 in .zip Keltner Channel for MetaTrader 4 in .mq4 Keltner Channel for MetaTrader 5 in .zip Keltner Channel for MetaTrader 5 in .mq5Discussion
Do you have any suggestions or questions regarding this indicator? You can always discuss Keltner Channel with the other traders and MQL programmers on the indicators forums.
Changelog
1.01 - 2022-03-08
- Improved indicator's inputs and looks control in the MT4 version.