There are a few different types of moving averages that you may encounter while trading Forex. Among these is the Triple Exponential Moving Average (TEMA). This type of moving average suffers from less lag than other types of EMAs.
What is the Triple Exponential Moving Average indicator?
The Triple Exponential Moving Average is described well by the components of its name. It is an exponential moving average (EMA) that has been triple-smoothed.
The Triple Exponential Moving Average was created by Patrick Mulloy in 1994. He also is the inventor of the double exponential moving average (DEMA).
Just in case you are new to moving averages, they are lagging indicators. Here is how to calculate an exponential moving average:

Where α is a smoothing factor that is usually calculated as 2 / (N + 1), where N is the period of the moving average.
We share the formula for calculating the Triple Exponential Moving Average below.
Key point:
The Triple Exponential Moving Average is just what it sounds like: a triple-smoothed EMA.
How is the Triple Exponential Moving Average indicator calculated?
Here is the formula that you can use to calculate the Triple Exponential Moving Average:


This multi-step formula would be quite complicated to do by hand, but thankfully, you do not have to do this yourself. Your charting software will take care of it for you.
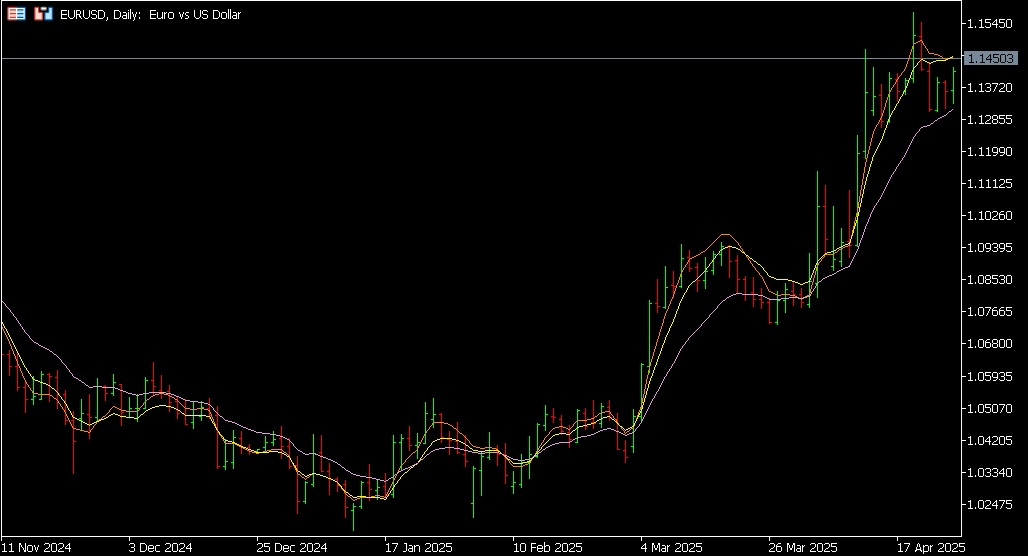
The image above shows the TEMA plotted along with a Double Exponential Moving Average and a Single Exponential Moving Average.
- The orange line is the Triple Exponential Moving Average.
- The yellow line is the Double Exponential Moving Average.
- The purple line is the Single Exponential Moving Average.
You can see that the orange line, the TEMA, is the one that lags the least, while the purple line, the regular EMA, lags the most.
Key point:
The formula for TEMA is related to that of the double- and single-smoothed EMAs. It just takes it a step further.
What does the Triple Exponential Moving Average indicator show us?
Once you have plotted a moving average on your chart, you see a smoothed-out line that follows price with a degree of lag. Since the lag is reduced with the TEMA compared to other moving averages, it follows price more closely.
The line of a moving average gives you a visual representation of closing prices (or whatever you use when calculating it). It can be used as a line of support and resistance in your trading strategies.
Key point:
The Triple Exponential Moving Average gives you a visual depiction of the movement of price, and may help you to identify support or resistance.
How to plot the Triple Exponential Moving Average indicator on your charts
Here is how you can plot the Triple Exponential Moving Average in MetaTrader 5:
- Go to Insert, in the top menu, then Indicators, then Trend.
- Click on Triple Exponential Moving Average.
- In the dialog box that comes up, you can enter in the period, and decide whether to apply to Close, Open, High, Low, Median Price, Typical Price, Weighted Close, or Previous Indicator's Data. Close is the default.
- Choose your line style settings, and click OK. The line will be plotted on your chart by MT5.
Note that the Triple Exponential Moving Average is not available in MetaTrader 4 as a default indicator.
Key point:
It is quick and easy to plot the TEMA on your chart in MT5. You just enter in a few simple options, and the charting software does the rest.
How to use the Triple Exponential Moving Average indicator while you trade
Now that you know how to plot the TEMA on your chart, let's discuss how you can use it as part of your trading strategies for Forex.
In general, when price moves above the TEMA, that is a bullish sign. When price moves below the TEMA, that is a bearish sign.

In the image above, you can see that when price broke strongly above the TEMA, it was the start of a strong upward move. You can also see that the TEMA then acts as resistance while price continues to surge upward.
Here is a chart that shows you what a bearish TEMA crossover looks like:

This is a high-quality setup, as there is a clean break of the TEMA after it held very strongly as resistance, along with a pinbar, which is a sell signal.
You probably will notice some of the potential hazards of using the TEMA while looking at these images, however, especially in the first image we shared showing the bullish crossover.
Price routinely tests the TEMA, dipping above or below it. So, you must be mindful of fakeouts. That means you need to place your entries sufficiently far out from the TEMA that you are unlikely to be caught by these fakeouts.
For this reason, most people also do not just use an exponential moving average like the TEMA all on its own. A setup is much stronger if you have some kind of confirmation, whether from price action or another indicator. The use of the MACD indicator is especially popular in conjunction with the TEMA. The Stochastic oscillator is another popular choice.
Something else that can help is making sure you are using the TEMA in the best market conditions. Ranging, choppy markets are far from ideal. The TEMA performs best with strong, relatively smooth trends.
Key point:
You can use the TEMA to help you identify entry points to trade trends. When price breaks above the TEMA, it is bullish. When it breaks below, it is bearish. But you may want to use other indicators to help you find confluence. That way, you can trade with confidence.
General tips for using the Triple Exponential Moving Average indicator
Here are some tips that will help you to use the Triple Exponential Moving Average effectively while trading.
- Use the TEMA to trade with the trend, or to spot and trade trend reversals. You can use it for capturing large movements, or smaller ones within a trend. Test out different setups and figure out what works best for you.
- When you test your TEMA strategies, make sure you are doing so in the market conditions in which you intend to place real trades.
- Do not consider price crossovers of the TEMA to be a complete strategy. Look for confluence using price action or technical indicators, as discussed.
- Do plenty of testing. It can take quite a few trades to become an expert in telling good setups from bad ones, given the frequent fakeouts.
Key point:
The TEMA is a valuable tool, but for it to be effective, you need to conduct thorough testing, and make use of additional indicators or price patterns. You also need to consider the market context.
Conclusion: The TEMA helps you visualize smoothed-out price movements with minimal lag
The Triple Exponential Moving Average is a useful way of smoothing out price and viewing support and resistance. When price crosses over the TEMA, it can be a buy or sell signal, especially in confluence with other indicators.