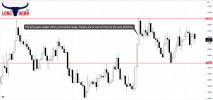
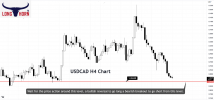
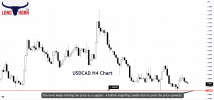
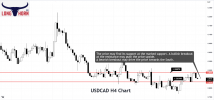
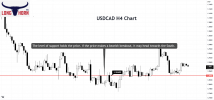
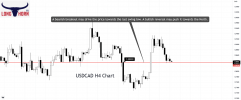
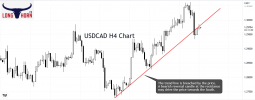
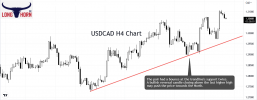
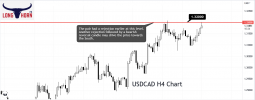
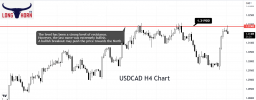
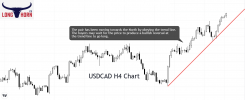
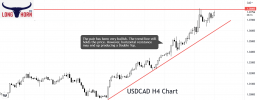
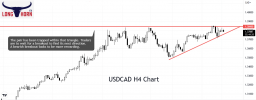
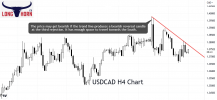
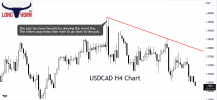
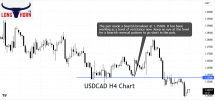
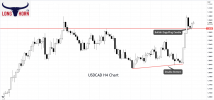
USDCAD had a bounce at 1.28400 and made a strong bullish move in the H4 chart. The pair had a bounce around the level earlier, thus the buyers may consider it as a Double Bottom support. The chart produced consecutive bullish candles and later found its resistance around 1.30800. It had its bearish correction with two bearish candles and found its support at 1.30190 area, where it produced a bullish engulfing candle. Thus, the buyers may go long in the pair and push the price towards the North further. The level of 1.30800 looks to be a strong level of resistance, but the way the price made its move towards the North in the H4 chart, it may end up making a breakout there. The price may find its next resistance around 1.32250.
On the other hand, if the level of 1.30800 produces a bearish reversal candle and makes a bearish breakout at 1.30190 area, the bear may head towards the South with a moderate pace and find its support around 1.29350.
On the other hand, if the level of 1.30800 produces a bearish reversal candle and makes a bearish breakout at 1.30190 area, the bear may head towards the South with a moderate pace and find its support around 1.29350.


