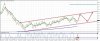
I have prepared some intraday levels for usd/cad. they are based mostly on high institutional volumes using market profile and orderflow. Have a look guys. I have also started a thread with my intraday levels that I update daily. happy trading 🙂
I see the forming of a bear trend, and the two blue candles of the indicator allow to open a deal to buy, although the asset was flat, I expect a small growth.
Right now, I can’t see the entrance for opening a deal on the asset, so I’ll wait until the price reaches one of the levels, and then I’ll make a decision.
That's what I can say about the USD/CAD
1. I've built two Gann fans. The first fan to H4 shows a clear buy signal, as the price has reached 2:1, and if it's broken, the next stop is the resistance 1.3207 or higher to 3:1.
2. The price level ranges between 1:3 and 1:4 for the H1, which shows the ambiguity of short-term trends. The price may break the level of 1:4 and reach the 1:8 and start the correction. But it's also possible that the chart will grow, because the stop at the level of 1:4 typically determines the return to 1:2.
Price correction usually begins after reaching 3:1. At the same time, the depth of this correction may be limited to movement along the support level. In this case, the price can overcome and break the level of 3:1 and go to a meeting to a level of 4:1 (1.33700).
If the correction will be prolonged, the price probably will not overcome the level of 3:1, although it is likely the price will try to test it.
On the USD-CAD D1 chart, the price is much ahead of the moving average MA7. On Friday, the figure formed a repulsed attack.
Assume a price reduction to the level of MA7 and then MA14. STOP LOSS above 1.3436 is the maximum of Friday.
USD/CAD today will be ahead of the choice of direction of movement.
The rate is at the level of 1:2 Gann. This level of initial correction may be a resistance. The effect of this resistance can reduce the price to a deeper level of 1:3.
Also, you need to take into account that the graph is above the 1:1 level (yellow). This means that the 1:1 level (yellow) is the support. This level can be tested again. But at the same time, it's likely that the downtrend will be changed to bullish in the near future.