The SuperTrend Plus Indicator MT4 is a trend-based analytical tool that combines dynamic support and resistance detection with market noise filtering to identify precise entry and exit points. ⚡
This indicator works without lag, adjusting its position in real time with price changes, ensuring traders can react instantly to trend shifts.

The SuperTrend Plus Indicator uses dynamic price ranges and market volatility (ATR – Average True Range) to draw a real-time support and resistance channel:
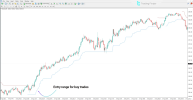
On the XAU/USD 1-minute chart, when the green line appears below the candles, the market enters a bullish phase .
High-volume candles with short lower wicks near this line indicate strong buying pressure, signaling a potential entry zone for long trades.
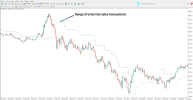
On the NASDAQ 100 (NAS100) 1-minute chart, when the red line appears above the candles, it signals a bearish trend .
Strong bearish candles with long upper wicks confirm selling pressure, creating conditions for short trade entries.
The SuperTrend Plus Indicator is a robust trend analysis tool that dynamically displays support and resistance levels, helping traders identify accurate entry and exit points.


This indicator works without lag, adjusting its position in real time with price changes, ensuring traders can react instantly to trend shifts.
Specifications
- Indicator Categories: Currency Strength | Trading Assist | Momentum MT4 Indicators
- Platform: MetaTrader 4
- Skill Level: Elementary
- Indicator Type: Reversal
- Timeframe: Multi-Timeframe ⏱️
- Trading Style: Intraday Trading ⚡
- Markets: Forex | Crypto ₿ | Stocks
- Download: https://cdn.tradingfinder.com/file/510994/supertrend-plus-mt4-by-tflab.zip

⚙️ How It Works
The SuperTrend Plus Indicator uses dynamic price ranges and market volatility (ATR – Average True Range) to draw a real-time support and resistance channel:
- Blue Line – Indicates the start or continuation of an uptrend; plotted below the candles.
- Red Line – Indicates the start or continuation of a downtrend; plotted above the candles.
Uptrend Example
On the XAU/USD 1-minute chart, when the green line appears below the candles, the market enters a bullish phase .
High-volume candles with short lower wicks near this line indicate strong buying pressure, signaling a potential entry zone for long trades.
Downtrend Example
On the NASDAQ 100 (NAS100) 1-minute chart, when the red line appears above the candles, it signals a bearish trend .
Strong bearish candles with long upper wicks confirm selling pressure, creating conditions for short trade entries.
⚙️ SuperTrend Plus Settings
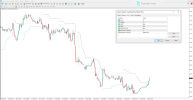
- PERIOD – Number of candles in one cycle
- MULTIPLIER – Amplifies the distance of the band
- ALERT – Enables notifications for trend changes
- EMAIL – Sends alerts via email
- NOTIFICATION – Push notifications to MT4/mobile
- MESSAGE TIMEOUT – Delay between alert messages
- MESSAGE SUBJECT – Custom subject line for alerts
Conclusion
The SuperTrend Plus Indicator is a robust trend analysis tool that dynamically displays support and resistance levels, helping traders identify accurate entry and exit points.
- Bullish setup – Green line below price indicates upward momentum.
- Bearish setup – Red line above candles signals downward pressure.


