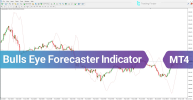
Bulls Eye Forecaster Indicator – MT4 Trend Prediction Tool
The Bulls Eye Forecaster Indicator MT4 is a powerful technical analysis tool designed for identifying trend reversals and detecting market momentum across financial instruments such as Forex, cryptocurrencies, commodities, indices, and stocks.How It Works
This MetaTrader 4 (MT4) indicator overlays red dotted lines on the price chart to mark:· Potential trend reversal zones
· Areas of trend continuation
· Optimal trade entry and exit points
The positioning of these lines provides visual cues on market sentiment:
· Below candles → signals bullish momentum
· Above candles → signals bearish momentum
Indicator Specifications
Category | Details |
Indicator Type | Reversal & Momentum Detection |
Trading Style | Intraday |
Skill Level | Intermediate |
Timeframe Compatibility | Multi-Timeframe |
Supported Platforms | MetaTrader 4 (MT4) |
Markets | Forex, Crypto, Stocks, Indices, Commodities |
Category Tags | Currency Strength, Trading Assist |
Download Link |
Key Features
· Fast detection of trend shifts· Highlights strong momentum areas for entry
· Visual trend confirmation via dotted line placement
· Supports multiple asset classes and timeframes
Bullish Trend Example
On the daily chart of the Dow Jones Index (DJI), when the red dotted line appears below the candles with significant depth, it indicates strong bullish momentum. These zones are ideal for buy entries.Visual cue: Dotted line below price = Buy zone
Bearish Trend Example
In the 4-hour chart of GBP/JPY, when the red dotted line forms above the candles and the distance increases, it signals intensifying selling pressure. These areas are considered favorable for sell trades.Visual cue: Dotted line above price = Sell zone
Conclusion
The Bulls Eye Forecaster Indicator offers a reliable method for anticipating trend changes and identifying momentum zones. By analyzing the relationship between the indicator’s dotted lines and price action, traders can spot high-probability entry and exit points with confidence.Whether you're trading Forex, crypto, stocks, or commodities, this tool can be a valuable addition to your technical strategy.


