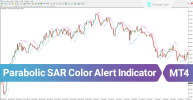
The Parabolic SAR Color Alert Indicator in MT4 is a powerful trading tool designed to visually display market trends using colored dots . These dots appear either above or below candlesticks, making it easy for traders to identify the current direction of price movement.
The color change of dots happens instantly when a trend shift is detected, giving traders a clear and reliable reversal signal.
Built-in alerts keep users updated on trend changes via:
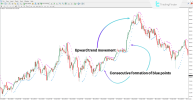
On the Binance Coin (BNB) 1-hour chart:
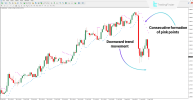
On the USD/CAD 1-hour chart:
The Parabolic SAR Color Alert Indicator is an effective tool for spotting trend direction and potential reversals. With its visual signals and multi-channel alerts, it simplifies market analysis and boosts trading confidence.
Customizable parameters like step size, precision, and alert settings make it flexible and adaptable to different trading strategies—whether for scalpers, swing traders, or day traders.


- Blue dots below candles → indicate an upward/bullish trend
- Pink dots above candles → indicate a downward/bearish trend
Specifications
- Indicator Categories: Signal & Forecast | Volatility | Trading Assist
- Platform: MetaTrader 4 (MT4)
- Skill Level: Beginner-friendly
- Type: Reversal Indicator
- Timeframe: Multi-Timeframe ⏱️
- Trading Styles: Day Trading | Scalping ⚡ | Swing Trading
- Markets Supported: Forex | Crypto | Stocks | Commodities ️ | Indices | Shares
- Download: https://cdn.tradingfinder.com/file/504861/parabolic-sar-color-with-alert-mt5-by-tflab.zip
Indicator at a Glance
The color change of dots happens instantly when a trend shift is detected, giving traders a clear and reliable reversal signal.
Built-in alerts keep users updated on trend changes via:
- On-screen notifications
- Email alerts
- Mobile push notifications
Buy Setup Example
On the Binance Coin (BNB) 1-hour chart:
- The sequence of pink dots was broken upward.
- Consecutive blue dots formed below candles, confirming the start and continuation of an uptrend .
Sell Setup Example
On the USD/CAD 1-hour chart:
- Price broke below a sequence of blue dots.
- Successive pink dots above candles signaled sustained bearish momentum .
⚙️ Settings Panel
- Step: Defines the movement step in calculating new dots
- Maximum: Maximum value of acceleration in the SAR formula
- Precision: Decimal display setting
- Alerts: Configure sound alerts
- Email: Enable/disable email notifications
- Push Notifications: Activate trend change alerts on mobile
- Message Timeout: Interval between alert signals
- Message Subject: Custom title for alert messages
Conclusion
The Parabolic SAR Color Alert Indicator is an effective tool for spotting trend direction and potential reversals. With its visual signals and multi-channel alerts, it simplifies market analysis and boosts trading confidence.
Customizable parameters like step size, precision, and alert settings make it flexible and adaptable to different trading strategies—whether for scalpers, swing traders, or day traders.


