iAvg

NCDindia

Active Trader
Jun 25, 2015
13
0
27
iAvg Volume is a local VTL script which displays the volume, and the average volume over the period specified. It is the volume and moving average of volume. Since volume is not available, we are using simulated volume (where simulated volume is increased with increasing price, and reduces with reducing price)

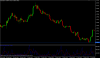
Blue line is volume, red is average. It is powerful, if volume information is available blue moving above red means bullish, blue falling below red means bearish.
 

Attachments

  • iavg.png
    iavg.png
    38.9 KB · Views: 55
  • iAvgVol.zip
    2.9 KB · Views: 33

NCDindia

Active Trader
Jun 25, 2015
13
0
27
The iAvgVol indicator is a client side VTL Script which displays the current volume (BLUE) and the moving average of this volume (RED) over the 5 bars on the chart. Increasing average volume (RED) means that the price is getting strong on the chart, and a decreasing average volume means that price is falling. It is used to determine start and end of trends. When the volume in vertex fx chart(BLUE) and the average volume (RED) both are moving upwards, it implies the start of strong uptrend. The trader may consider exiting SHORT positions (if any), and opening LONG positions.
When both the volume (BLUE) and the average volume (RED) in the vertex fx are both moving downwards, it implies the end of uptrend and start of a downtrend. The trader may consider exiting LONG positions and opening SHORT positions. In vertex Fx this local script can be used with other volume based and price based indicators to confirm the direction of a trend.