EMA-4-MTF-Strategy
Manual Trading System
Exponential Moving Average For Multiple Time Frame
Time Frame: 10 sec., 30 sec., 1 min., 5min., 15 min., 30 min., 1h, 3h, 4h, 1 day, 1 week
Currencies: all
Exception of the rule: 10 sec TF - only EUR/USD (with Spread ~1.5)
Indicators: EMA 9, 20, 55, 120, 200
Enter/Exit: EMA9/EMA20 crossover
(Higher risc: when bar crosses EMA 9 and closes at counterpart side)
Hold: when EMA 9 < EMA 20 (bearish) or 9 > 20 (bullish)
Download:
Indicators see p.4, #34 (without EMA 200), <"indicators.zip">
---
Demo Account:
Open Day: 2009 Dezember 01 - Account Deposit: 100'000.- $
Closed Trade P/L: 17'532.44 $
Floating P/L: 0.00 $
Equity: 117'532.44 $
Balance: 117'532.44 $
Profit: + 17'532.44 $
update:
further results see under "report":
http://forexcube.ch/EMA-4-MTF.htm
Label:
E = IN (Entry)
O = Out (Exit)
... with some co-occuring entry and exit-points (O/E)
EMA 9 / 20 EMA
9 EMA entry works on any time frame, waiting untill the price bar closes above 9 EMA to enter long or below 9 EMA to go short.
EMA9 crosses EMA20 indicate confirmation that you're trading an infinite deal more with the trend, but it's not necessary, even though you could deal with it. There are no seconds doubts acting now or waiting a bit longer!
55 EMA / 120 EMA / 200 EMA
55 EMA, 120 EMA, 200 EMA indicate more the global trend and gives psychologically speaking orientation, when EMA 9 getting vulnerable to sideways shoppy prices.
EMA's don't extend in the future, they can only follow market price.
EMA-4-MTF Trading Strategy based on fast moving averages are quite easy to follow. It is easy to use and gives very good results exceedingly when the market is trending, during big price break-outs and big price moves. It does not predict the future market directions, but rather reflects current situation on the market. So it can change its signals any time, second – you need to watch it all the time. When market trades sideways (not trending) with little fluctuation in price it can give on higher timeframes false signals, so it is not suggested to use it during such period with TF > 15 min.
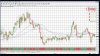
EURUSD 10sec., 1min, 5min
Label:
E = Entry (In) (might be SHORT or LONG)
O = Out (Exit)
The "O?" markers are close matched points adequate for making serveral bips.
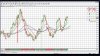
EURUSD 1 min
Label:
E = Entry (In) (might be SHORT or LONG)
O = Out (Exit)
The "O?" markers are close matched points adequate for making serveral bips.
Practical suggestion:
P1 - P4 - P5 - P6 - P7 (E) - P8 (O/E) - P10 - P12 - P13
EMA-4-MTF Strategy is used for:
(a) trading the same currency with one time frame
(b) trading the same currency with multiple timeframes
(c) trading different currencies with the same time frame.
(d) trading different currencies with multiple time frames.
Rule of speciality
GBP/JPY will have an average daily range around 120 – 170 pips, so you do better setting on 5 min or 15 min chart, instead of a 1 min chart. GBP/JPY have further a broad spread.
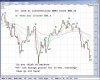
GBPJPY M1, M5, H1 2009 oct. 11
Price data can change very much from every day and still conceal if the price is growing or decreasing. You see even a more general picture if you watch the moving price averages on higher time frames.
Label:
E = Entry (In) (might be SHORT or LONG)
O = Out (Exit)
The "O?" could be convert when you think pips are enough at this point.
Entry: preferred when Bars crosses EMA 9 and close on counterpart (or 9/20 crossover).
Exit: could be with EMA9/20 intersection.
Manual Trading System
Exponential Moving Average For Multiple Time Frame
Time Frame: 10 sec., 30 sec., 1 min., 5min., 15 min., 30 min., 1h, 3h, 4h, 1 day, 1 week
Currencies: all
Exception of the rule: 10 sec TF - only EUR/USD (with Spread ~1.5)
Indicators: EMA 9, 20, 55, 120, 200
Enter/Exit: EMA9/EMA20 crossover
(Higher risc: when bar crosses EMA 9 and closes at counterpart side)
Hold: when EMA 9 < EMA 20 (bearish) or 9 > 20 (bullish)
Download:
Indicators see p.4, #34 (without EMA 200), <"indicators.zip">
---
Demo Account:
Open Day: 2009 Dezember 01 - Account Deposit: 100'000.- $
Closed Trade P/L: 17'532.44 $
Floating P/L: 0.00 $
Equity: 117'532.44 $
Balance: 117'532.44 $
Profit: + 17'532.44 $
update:
further results see under "report":
http://forexcube.ch/EMA-4-MTF.htm
Label:
E = IN (Entry)
O = Out (Exit)
... with some co-occuring entry and exit-points (O/E)
EMA 9 / 20 EMA
9 EMA entry works on any time frame, waiting untill the price bar closes above 9 EMA to enter long or below 9 EMA to go short.
EMA9 crosses EMA20 indicate confirmation that you're trading an infinite deal more with the trend, but it's not necessary, even though you could deal with it. There are no seconds doubts acting now or waiting a bit longer!
55 EMA / 120 EMA / 200 EMA
55 EMA, 120 EMA, 200 EMA indicate more the global trend and gives psychologically speaking orientation, when EMA 9 getting vulnerable to sideways shoppy prices.
EMA's don't extend in the future, they can only follow market price.
EMA-4-MTF Trading Strategy based on fast moving averages are quite easy to follow. It is easy to use and gives very good results exceedingly when the market is trending, during big price break-outs and big price moves. It does not predict the future market directions, but rather reflects current situation on the market. So it can change its signals any time, second – you need to watch it all the time. When market trades sideways (not trending) with little fluctuation in price it can give on higher timeframes false signals, so it is not suggested to use it during such period with TF > 15 min.
EURUSD 10sec., 1min, 5min
Label:
E = Entry (In) (might be SHORT or LONG)
O = Out (Exit)
The "O?" markers are close matched points adequate for making serveral bips.
EURUSD 1 min
Label:
E = Entry (In) (might be SHORT or LONG)
O = Out (Exit)
The "O?" markers are close matched points adequate for making serveral bips.
Practical suggestion:
P1 - P4 - P5 - P6 - P7 (E) - P8 (O/E) - P10 - P12 - P13
EMA-4-MTF Strategy is used for:
(a) trading the same currency with one time frame
(b) trading the same currency with multiple timeframes
(c) trading different currencies with the same time frame.
(d) trading different currencies with multiple time frames.
Rule of speciality
GBP/JPY will have an average daily range around 120 – 170 pips, so you do better setting on 5 min or 15 min chart, instead of a 1 min chart. GBP/JPY have further a broad spread.
GBPJPY M1, M5, H1 2009 oct. 11
Price data can change very much from every day and still conceal if the price is growing or decreasing. You see even a more general picture if you watch the moving price averages on higher time frames.
Label:
E = Entry (In) (might be SHORT or LONG)
O = Out (Exit)
The "O?" could be convert when you think pips are enough at this point.
Entry: preferred when Bars crosses EMA 9 and close on counterpart (or 9/20 crossover).
Exit: could be with EMA9/20 intersection.
Attachments
-
 GBPJPY, M1, M5, H1,2009 oct.11.jpg61.2 KB · Views: 126
 -
 EMA-4-MTF, EURUSD,10sec.jpg44.8 KB · Views: 118
 -
 EMA-4-MTF, EURUSD, 10.sec., 2009.09.17.jpg54.8 KB · Views: 81
 -
 EURUSD, 10 sec., M1, M5.jpg52 KB · Views: 82
 -
 EU, M1, 2009_oct_06.jpg50.4 KB · Views: 67
 -
 GJ, M1, M5, H1,1009 oct.11.jpg67.2 KB · Views: 92
Last edited: