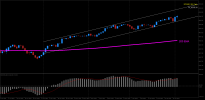
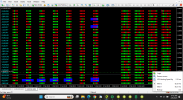
charts from the technical side

hayseed

Master Trader
Jul 27, 2010
1,048
262
149
usa
just some charts that interested me at the time...... all will be based on some technical indicator........

enivid has made a td sequential indicator available......

daily td sequential counts of 20 are rare...... another, which i painful remember, was the nzdusd in 2017.....

spain35.......h
//----
spain35-d1-tf-global-markets-td-20.png
 

hayseed

Master Trader
Jul 27, 2010
1,048
262
149
usa
gann fans are included with metatrader...... that in itself suggests, to me, they must be of value......

they are something i seldom use, due to my lack of full understanding...... so my use here might be incorrect.......

looks like france started lighting the fireworks early...... still 3 weeks till the new year.......

would be a shame if it fizzled out early......h
//-------

fra40-d1-tf-global-markets.png


//------
fra40-d1-tf-global-markets-fireworks.png


//-----
 

Attachments

  • 2005_George_A_Maclean_Fibonacci_and_Gann_Applications_in_Financial_Markets.pdf
    7.7 MB · Views: 1

hayseed

Master Trader
Jul 27, 2010
1,048
262
149
usa
mcclellan has mentioned in the past about type 1 and type 2 examples of the golden cross/death cross...........

estx50 might be approaching a text book example......

no matter if type, 1, type 2 or otherwise, the price will often pull back....... especially if the price was extended at the time of the cross......

it is extended now..... lime is the 50, red is the 200, yellow dashed is level of prior cross and predicted level golden cross......

a short squeeze tends to end the day in a pin bar.......

it did not......h
//------
estx50-d1-tf-global-markets-death-cross-golden-cross.png
 

hayseed

Master Trader
Jul 27, 2010
1,048
262
149
usa
uk100...... descending triangle..... page 26 in fidelity's chart patterns pdf below......

uk100 is approaching it's descending downtrend line...... very likely this week, almost for sure this year......

last chart has yearly pivot which is a single days atr from support...... breaking that support would imply a downside target almost beyond belief.....

should prove interesting......h
//-----

uk100-d1-tf-global-markets-1.png


//-------
uk100-d1-tf-global-markets-3.png


//-----
uk100-d1-tf-global-markets-4.png


//------
uk100-d1-tf-global-markets-5.png
 

Attachments

  • Idenitfying-Chart-Patterns.pdf
    1.6 MB · Views: 0
  • understanding classic chart patterns.pdf
    641.2 KB · Views: 0

hayseed

Master Trader
Jul 27, 2010
1,048
262
149
usa
copper....... descending triangle..... in the face of rising interest rates.....

it's long been said commodities are a leading indicator...... the logic there is quite agreed upon.......

commodity currencies, aud, nzd, cad, are also considered leading indicators....... they lead the up and they lead down.......

copper broke above it's descending trend line and is within 5 days of rising above it's yearly pivot......

rising rates target commodity prices as they are a large part of inflation...... with the central banks standing firm on rates, that support line looks awful inviting......

downtrends are a hard habit to brake......h
//-------

copper-d1-tf-global-markets.png
 

hayseed

Master Trader
Jul 27, 2010
1,048
262
149
usa
have you ever looked at the charts and said, ' dang't why didn't i get the memo '.......

one of my 2024 rules is going to be running daily signal scans....... with a time stamp......

no one to blame but myself.......h

//------

natural gas...... daily and weekly......
//-----

ngas-d1-tf-global-markets-gas.png

//-------

ngas-w1-tf-global-markets-gas.png
 

hayseed

Master Trader
Jul 27, 2010
1,048
262
149
usa
2/4/24.......

meet the only pair in oanda's common 26 that has it's daily macd above the signal line...... cadchf......

that 50 ma might have the find word......h
//------

cadchf-d1-oanda-division1-2.png
 

hayseed

Master Trader
Jul 27, 2010
1,048
262
149
usa
Am I right in thinking you have been able to automate this process ?
//-----

yes..... for many years...... my problem is in not running them...... that was the reason for the time stamp...... the scan script creates a screenshot and the chart is placed in your files folder...... then you can look back at them later.....

can't count the times i've looked at the chart today and said , 'dang, how'd i miss that perfect signal last week'......

about like not checking the gas gauge......h
 

hayseed

Master Trader
Jul 27, 2010
1,048
262
149
usa
Am I right in thinking you have been able to automate this process ?
//----

yes that link you sent was the route i took......

if you click on the connection status in the lower right corner, it brings up that little box..... it shows you the various speeds..... each broker speed is different..... one of mine is often maybe 200, where the vps comparison for it is lees than 1......

if you then click on the vps speed up, it will take you to metaquotes vps page..... about maybe 5 clicks later you can have a ea running on the vps....

if i do it again, i'll create and upload video to youtube...... metaquotes has a couple 2 minute videos ......

it only costs about 10 or 15 bucks a month....... that's about the price of a meal at burger king that i don't need anyway,,,,,,h
//-------

connection.png
 

Maverick

Master Trader
Apr 3, 2014
453
6
79
Bournemouth UK
Tom Hougaard takes screen shots for all manner of reasons spending hours studying them before the start of his trading day ... I have in the past spent hours watching him trade LIVE on Telegram ... He spread bets like me often betting 200/point on the DAX, FTSE, DOW, NASDAQ

"If you bet pennies you will only ever win pennies"

Today
FTSE MINUS 12 = minus £3,600
DAX MINUS 39 = minus ££7,800
NASDAQ PLUS 11 = plus £2,200
DOW MINUS 84 = minus £8,400

January
Tom.png

BTW ... he keeps hard copies of all his screen shots
 

hayseed

Master Trader
Jul 27, 2010
1,048
262
149
usa
the 4 hour full value gap guys might be lookin at the gbpjpy and thinking it will close this week......

but then, those monthly full value gap guys have been saying that for 9 years......

not sure whether to post this here, or in the thread , 'are you just gambling'........

cause it is.......h
//------

gbpjpyx-h4-tf-global-markets-fvg.png


//-------
gbpjpyx-mn1-tf-global-markets-9-years.png
 

hayseed

Master Trader
Jul 27, 2010
1,048
262
149
usa
Which indicator do you use? Is it trend-following or momentum indicator?
//-----

hey fargana....... in that chart there, the only thing was the td sequential....... not sure if it would be trend type or momentum type..... it's probably neither...... but really never thought about it before......

as for normal use, my preference is for trend type indicators followed by momentum.....h
 

fargana

Active Trader
Nov 14, 2022
139
20
29
34
Nice.. can you suggest any indicators which can help to analysis markets in the same fashion? looks quite efficient..