CFD Technical Analysis

Pro.Trader

Newbie
Aug 12, 2026
10
0
1
56

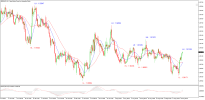
NZD/USD Technical Analysis​


NZD/USD trades near 0.5875 on Wednesday, August 12, 2026, pulling back for a third consecutive session. The pair is testing crucial support near 0.5855, weighted down by a firmer US Dollar driven by safe-haven demand. Price action remains consolidated below immediate resistance at 0.5910.

Immediate Support: 0.5850. A decisive breakdown below this level could open the door for a deeper decline toward 0.5800 and 0.5750 over the coming days.
 
EUR/USD Technical Analysis:

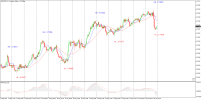
EUR/USD is trading near 1.1522 on Wednesday, August 12, 2026 under short-term selling pressure from key moving averages. A sustained break below current levels is required to open the door toward 1.1380, a major support zone where buyers previously built a strong base. On the upside, immediate resistance remains well-defined at 1.1581.

1786592857456.png
 
USD/CAD Technical Analysis:

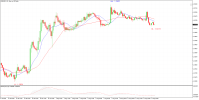
USD/CAD trades near 1.3947 on Thursday, supported by short-term buying interest around key moving averages. A sustained break above this level could pave the way toward 1.4015, followed by 1.4080, a major resistance zone that previously acted as a strong buyer base. On the downside, immediate support remains firm at 1.3907.

1786613233653.png
 
XAU/USD Technical Analysis: Short-Term Pullback Testing Key Pivot Zone

XAU/USD is currently trading near $4,320, encountering short-term downside pressure as price consolidates beneath dynamic moving average resistance.

Downside Risk & Structural Breakdowns
A decisive break and daily close below the $4,320 – $4,300 pivot cluster would confirm a deeper structural correction, exposing intermediate support at $4,165. Continued sell-side momentum below this level opens a path toward the primary $4,000 macro demand block, a major accumulation base that previously anchored the broader uptrend.

Upside Invalidation & Bullish Recovery
To neutralize current selling pressure, buyers must reclaim immediate resistance at $4,450. A high-volume expansion above this swing high would invalidate the short-term pullback and re-establish the primary bullish trend toward higher-timeframe objectives.

1786675338462.png
 
McDonald’s Corporation (NYSE: MCD) is currently trading within a medium-term consolidation phase following an extended pullback from its 52-week high near $341. With the stock hovering around the $272 area, price action reflects a tug-of-war between broader trend weakness and short-term mean-reversion buying.

Medium-Term Structure: Consolidation / Range-Bound.
MCD has recently broken above the upper boundary of its previous declining channel, signaling a transition from an aggressive downtrend into a sideways-to-slightly bullish phase.

Short-Term Structure: Mildly Bullish Recovery.
The stock is holding above its shorter-term moving averages, indicating improving momentum and continued dip-buying interest.

Bullish Scenario: Breakout / Continuation. Upside Targets: $290, followed by $310.
The bullish setup would be invalidated by a sustained move below $260.

1786685453792.png
 
Costco Wholesale (COST) is currently building an accumulation base around $952, consolidating just beneath the major $1,000 psychological milestone. The price action reflects a healthy digestion of recent gains, maintaining a higher-low structure above primary moving averages.

A decisive breakout through $1,000 and a daily close above $1,005 will confirm upside expansion toward the $1,060 macro projection target. The broader bullish bias remains fully intact as long as price holds above key demand. A daily close below $906 invalidates the current trade setup, signaling a structural breakdown and exposing sub-$900 liquidity zones.

1787038755582.png
 
GBP/AUD Quick Technical
  • Current State: GBP/AUD remains in a tight consolidation phase around 1.9130.
  • Bullish Path: A sustained move above 1.9165 would open the way toward 1.9280, with a broader upside target at 1.9425.
  • Bearish Path: A sustained break below 1.8990 would invalidate near-term demand and expose the pair to deeper downside momentum.
1787110121120.png
 
The NZD/JPY pair is hovering around the 93.50 zone. While lower intraday timeframes indicate short-term selling pressure, the Daily and Weekly timeframes remain aligned with a broader bullish macro trend.
  • Target 1 – Primary Structural Support: 92.50
    This level aligns with a major prior swing low and a high-volume node/demand zone on the Daily chart. A clean break below 93.50 would open the path toward 92.50.
  • Target 2 – Deeper Swing Support: 91.50
    A sustained Daily close below 92.50 would confirm a deeper corrective move, exposing 91.50 as the next major support zone.
  • Invalidation / Key Resistance: 94.30
    A sustained break above 94.30 would invalidate the bearish corrective structure and signal a potential continuation of the broader macro uptrend.
1787117706605.png
 
GBP/USD trades near 1.3590, consolidating just below the 1.3600 psychological level as short-term momentum tests the lower boundary of a rising channel.

Immediate Support: Located at 1.3490 and 1.3390 congestion zones.
Immediate Resistance: Positioned around 1.3675, followed by the heavier 1.3700 barrier.

Market Momentum
Short-Term Bias: Neutral to slightly bearish as the pair retreats from last week's highs near 1.3675.

1787886759602.png
 
AUD/USD is trading around 0.7165, extending its retreat from the May peak of 0.7277. The pair remains under near-term pressure after failing to sustain its move toward recent highs.

Technical Outlook:
Resistance: Immediate resistance is seen at 0.7208. A failure to reclaim this level would keep the short-term bearish bias intact.
Support: Initial downside support lies near 0.7100, followed by 0.7040. A break below 0.7100 could expose the 0.7040 area.
Momentum: Short-term momentum has turned lower following the rejection from multi-day highs. The price action suggests a corrective downside move, with a sustained break below 0.7100 potentially strengthening the bearish outlook.

Bias: The near-term outlook remains bearish below 0.7208, with 0.7100 and 0.7040 as the key downside levels to watch.

1787974130766.png