Brooky PSAR Levels Indicator for MT4
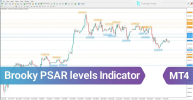
The Brooky PSAR Levels Indicator is an enhanced evolution of the traditional Parabolic SAR, extending its capabilities beyond simply indicating trend direction to dynamically highlighting key support and resistance zones.Unlike the conventional PSAR, which plots dots above or below price bars, this sophisticated tool pinpoints critical price levels—areas where price has historically reacted strongly, increasing the likelihood of reversals or breakouts.
Brooky PSAR Levels Indicator Table
Feature Category | Description |
Indicator Categories | Support & Resistance, Trading Assist, Levels MT4 Indicators |
Platform | MetaTrader 4 |
Skill Level | Intermediate |
Indicator Types | Breakout, Reversal MT4 Indicators |
Timeframe | Multi-Timeframe MT4 Indicators |
Trading Style | Intraday |
Trading Instruments | Share Stocks, Indices, Commodities, Stocks, Cryptocurrency, Forex |
Download Link |
Overview of the Brooky PSAR Levels Indicator
The Brooky PSAR Levels indicator utilizes the PSAR calculation to identify two key types of price levels on the chart, each displayed in distinct colors for clarity:- Resistance Levels (Upper PSAR):
When price ascends toward these levels, selling pressure commonly intensifies. Price may either reverse downward or break above and continue higher momentum.
- Support Levels (Lower PSAR):
When price declines toward these points, buying interest tends to increase, often resulting in a rebound or stabilization of price.
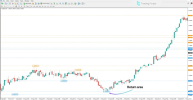
Application in Market Trends
In an Uptrend:
For example, on the AUD/NZD 1-minute chart, when price approaches a support level identified by the indicator during a downtrend, signs of waning selling pressure or a pause in the decline often surface. Reversal signals such as bullish candlesticks or a break above the downtrend line create a favorable zone to enter buy positions.
In a Downtrend:
On the Russell 2000 index (RUS2000) 1-hour chart, when price touches a key resistance zone accompanied by bearish reversal patterns, it signals declining buyer interest. This reinforces the probability of a downward trend continuation, marking an optimal area to consider short entries.
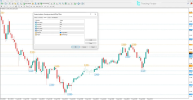
Brooky PSAR Levels Indicator Settings
Parameter | Description |
Bars Back | Number of historical candles to analyze |
Sar Step | Incremental step for PSAR calculation |
Sar Max | Maximum limit for PSAR step size |
Level Style | Visual style for level display |
Price Size | Font size for price labels |
Lowpsar | Internal variable for support PSAR levels below candles |
Hipsar | Internal variable for resistance PSAR levels above candles |