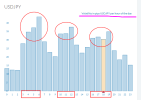
i just want to know in red box what the trader is talking about, as this is his technique he is explaining to enter trades at high potential times,
i understand he is talking about correlation strong/weak currency like that and tf also...
but what is daily high and low, is he talking about daily tf , if he is talking about daily tf then 3 to 5 hour of the daily high and low doesnt make sense to me..
plz let me know if somone know the answer.
thx