Why Do Currency Rates Change?
One day, you will see the euro quoted at 1.12758, and ten days later, it is 1.09437. (These price quotes are the high on 2023-07-18 and the low on 2023-07-28.) A change in price by 341 points is not abnormal. Later, we will talk about what is normal and how we know what is normal, but for the moment, you need to accept that Forex prices can move very far, very fast.
What is behind the change? The obvious answer is that euro traders were in the process of changing their minds about the value of either the euro or the value of the dollar. Actually, since no one knows or can even guess what the true value might be, the euro trader is guessing what others will think in the future about the appropriate price of the euro or the dollar. If the euro trader is a seller today at 1.12758, it is because he interprets some piece of data or news unfavorable to the euro that will make others unwilling to pay as much for it as today’s price. The future may be two minutes, two days, or two weeks, but the skill of the trader lies in assigning a probability to the interpretation of the data or news by the rest of the market.
In other words, the euro trader is reading their minds about future demand for euros.
This sounds ridiculous, but it is an accurate way of describing the process. There are three components to the euro trader’s guess.
Component One: The Chart
The euro had become “overbought.” This term refers to a majority of euro traders believing the euro should go higher and having already built a big long position. The chart reader does not care whether the rest of the market is correct. He sees that in terms of the up move that has already taken place, the other traders are overinvested in the bullish point of view.
If everyone has already bought the euro and they are out of cash or credit to increase their holdings, there’s nobody left to buy. The price must fall as the holders unload their positions in order to get cash to put on new trades. The chart reader uses any of several technical indicators to identify when the market is overinvested or overbought. The most commonly used indicator is the relative strength index or RSI. Another is the stochastic oscillator.
It is important to note that in Forex, we do not have volume figures like the volume available in equity trading. If we had volume, we could see that as the price is rising, volume is failing to keep pace proportionately. A divergence between rising prices and falling volume is a classic technique in equities to gauge when a security is becoming overbought. Alas, in Forex, we do not have volume as a tool.
Component Two: The Economics
The only reason to buy something is to use it or to sell it later for a higher price. While the Forex trader will not actually use euros in the sense of spending them on goods and services, he anticipates that others will want to use the euro’s purchasing power to buy stuff, not only socks and haircuts but also securities denominated in euros. Therefore, Forex traders follow the macroeconomics and news stories pertaining to the relative purchasing power of the euro vs. the dollar, including inflation (or deflation), wage increases, the robustness of the economy, and so on. At any one time, the market as a whole has a consensus view of which economies are growing and how fast and which economies have immediate economic problems that the government and, specifically, the central bank should be addressing. As a rule, traders’ economic understanding is oversimplified and even crude and usually boiled down to a catchy one or two-word descriptor. Still, it does not pay to be snobbish about the relative lack of sophistication of these views—they move markets.
Component Three: The News
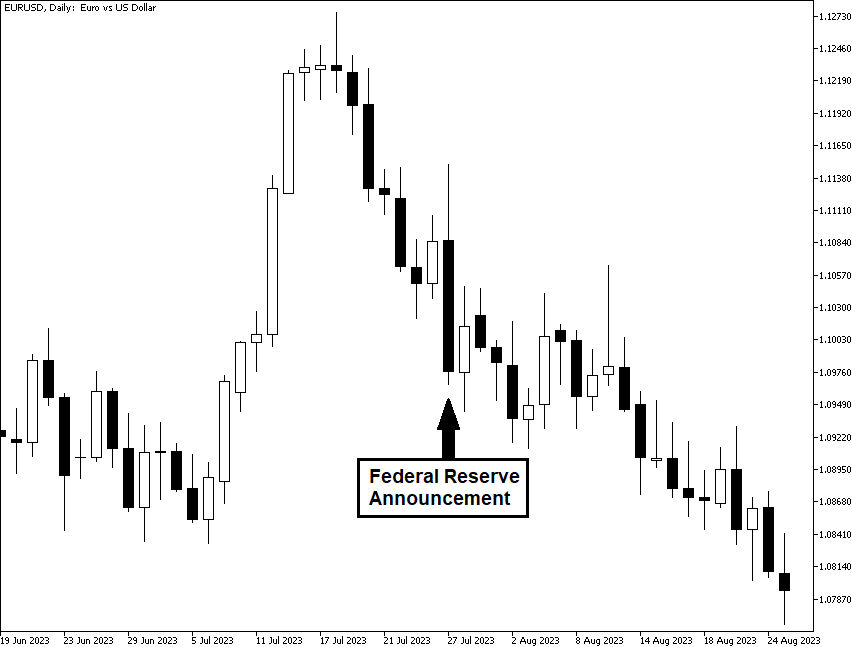
Macroeconomics form the background against which traders judge news. The single most important piece of news is a change in interest rates or other stimulus/contraction by a central bank. A good example is the interest rate decision by the Federal Reserve (Fed) on July 27, 2023. To combat the rapidly rising inflation, the Fed made a decision to increase interest rates and sent a signal that it is likely to raise the rates at least one more time by the end of the year. The dollar's purchasing power increased due to the decision, which can be seen on the chart as the sharp drop in the euro's strength versus the dollar's. It is interesting to note that the EUR/USD was falling faster before the interest rate announcement than after it. Such behavior is not uncommon when the result is expected and is priced in, and, indeed, markets were counting on the Fed's rate hike. The currency pair reversed its movement the next day as the European Central Bank (ECB) also hiked its interest rates. And again, the currency pair was moving faster before the announcement than after it. The probable reason is the same - the ECB's decision matched traders' expectations.
You would be hard-pressed to say the dollar reversed its previous decline because traders were thinking about some relative economic data — here the move was due to the Fed rate decision and the expectations of additional interest rate hikes in the future.