Long-Term Trading
Long-term refers to a holding period (from entry to exit) of more than a week and sometimes as long as several months. The great virtue of a longer holding period is that once you have identified a trend, you are likely to make a greater profit than when trading in and out over shorter periods. Not only do you save on transaction costs, but you also save your own time. The drawback is that trends never move in a straight line, and it can take nerves of steel to sit out the inevitable pullbacks. You also need confidence in your ability to differentiate between an ordinary pullback and a trend reversal.
Most of all, long-term trading usually entails blending fundamental analysis with technical analysis, a process that is complex and challenging but can put you at risk of embracing an ideology that is either wrong or not applicable to your particular trade. When there is a disconnect between what the chart shows is happening vs. what ideology dictates should be happening, the pragmatic solution is to ditch the ideology. After all, the essence of technical analysis is empirical observation. If observations clash with theory, the theory needs to be discarded. This can be very hard to do. For example, the environmental charity Greenpeace lost €3.8 million by betting the euro/dollar would fall after the European Central Bank cut rates in early June 2014. The error is understandable enough — currencies usually do fall in a falling interest rate environment. But this was a case where other factors carried more weight, including the long-standing bias in favor of the euro because of the ECB’s anti-inflation credibility and a sharp-eyed appreciation of the likelihood the Fed would remain dovish.
The long-term trader tends to use daily charts and will also consult weekly and even monthly charts, too. Consider the monthly chart of GBP/USD in the image below. The extreme high during the sideways movement, which followed the slump caused by the global economic crisis of 2008, was 1.71898 in July 2014, and the extreme low was 1.14754 in October 2016, reached after the crash caused by the outcome of the Brexit referendum. Anyone who correctly analyzed the situation in the UK during that period had a huge gain on going short. Now, let's look at the failed attempts at the recovery. Note that the bounce off the low carried the price to 1.43762 in April 2018 — about the level of the Fibonacci 50% retracement. About a year before that, the astute analyst could foresee the correction developing and would become a buyer at around 1.29246. Would a true long-term trader have stayed long the pound all the way to the beginning of 2024, hoping for a recovery? Those who engage in long-term trading are not disclosing that information, but plenty of “global macro” hedge funds and probably some sovereign wealth funds do trade in this manner.
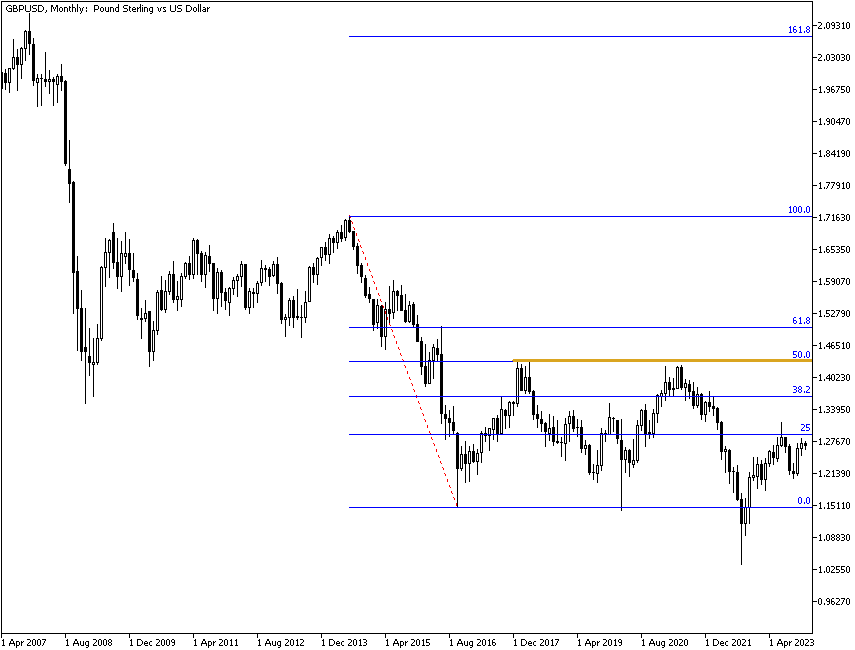
Notice that this trade would have suffered a near-catastrophic pullback in September 2022 and a long period – lasting more than seven years – of range trading, albeit in a wide range. Anyone judging trading performance on a mark-to-market basis would see only piffling gains.
A more satisfying version of the long-term trade would be less long-term — months, not years. See the weekly chart in the next figure. Here, we have a double bottom that is confirmed at the red horizontal line at 1.24477. A few weeks later, the price surpasses the green 10-week (50-day) moving average. We have a confirmed buy at 1.26798 in June 2023. Unfortunately for the bulls, as of the end of the data on this chart, the mark-to-market gain is just 28 points.
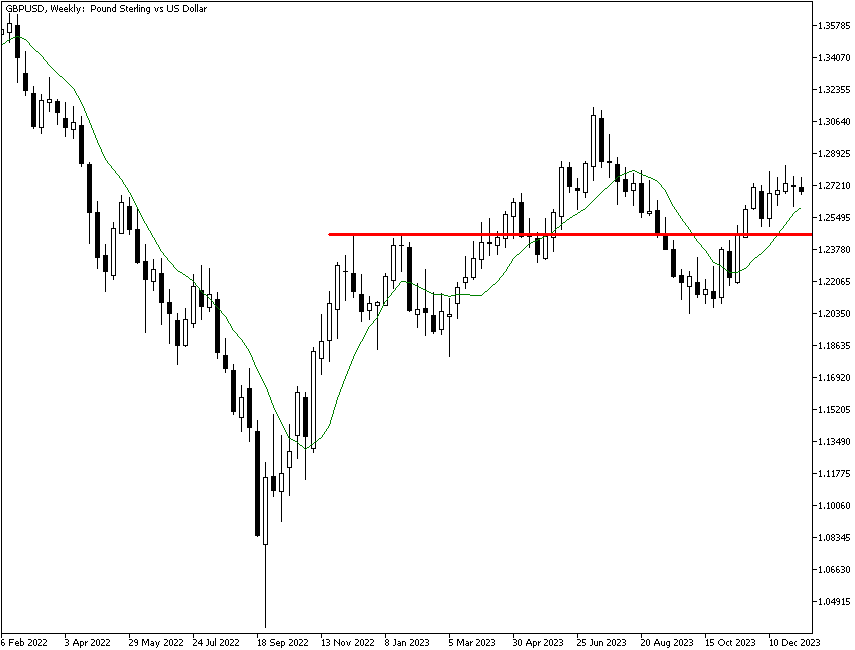
This gain demonstrates two features of long-term trading: first, you need patience, and you need indicators, even simple ones like the double-bottom pattern and the 10-week moving average, that you have total faith in. You could have used other indicators that would have gotten you in sooner, but remember, you are not actively trading in and out. You like to hold for months on end. This trade is already seven months old. Secondly, the entry-to-exit gains in long-term trading tend to be enormous if you have predicted the price moves correctly and are patient enough.
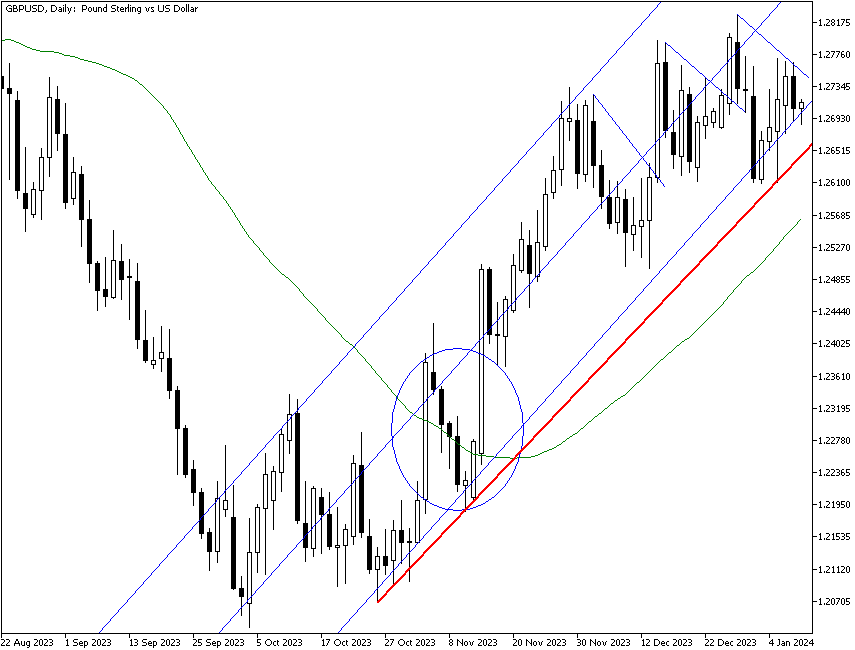
Another version of the long-term trade is even less long-term and uses the daily chart. Here, in using the crossover of the price above the 50-day moving average, the entry is later, in November instead of June, and the entry price is 1.24282. The mark-to-market gain as of the end of the data on the chart is 282 points. This is a significant gain, and it was made on a single simple indicator. The chart also shows diagonal lines marking interim pullbacks, which are acceptable to the long-term trader. It also shows a red support line that runs parallel to the linear regression channel for almost three months without being broken. The long-term trader would not panic and exit on a potential pullback unless the channel itself is broken. Besides, the long-term trader has been following the news that the UK economic recovery has put behind the risk of a big financial crisis and comments from the central bank that rate cuts will likely not happen until Q3 2024.
This example uses simple, basic indicators and nothing fancy to illustrate that long-term trading can be less difficult and stressful than day trading. Long-term trading removes momentum and volatility indicators from the menu and uses only trend-following indicators. The drawback of using only trend-following indicators is that they give you bad guidance in range trading and untrended markets.