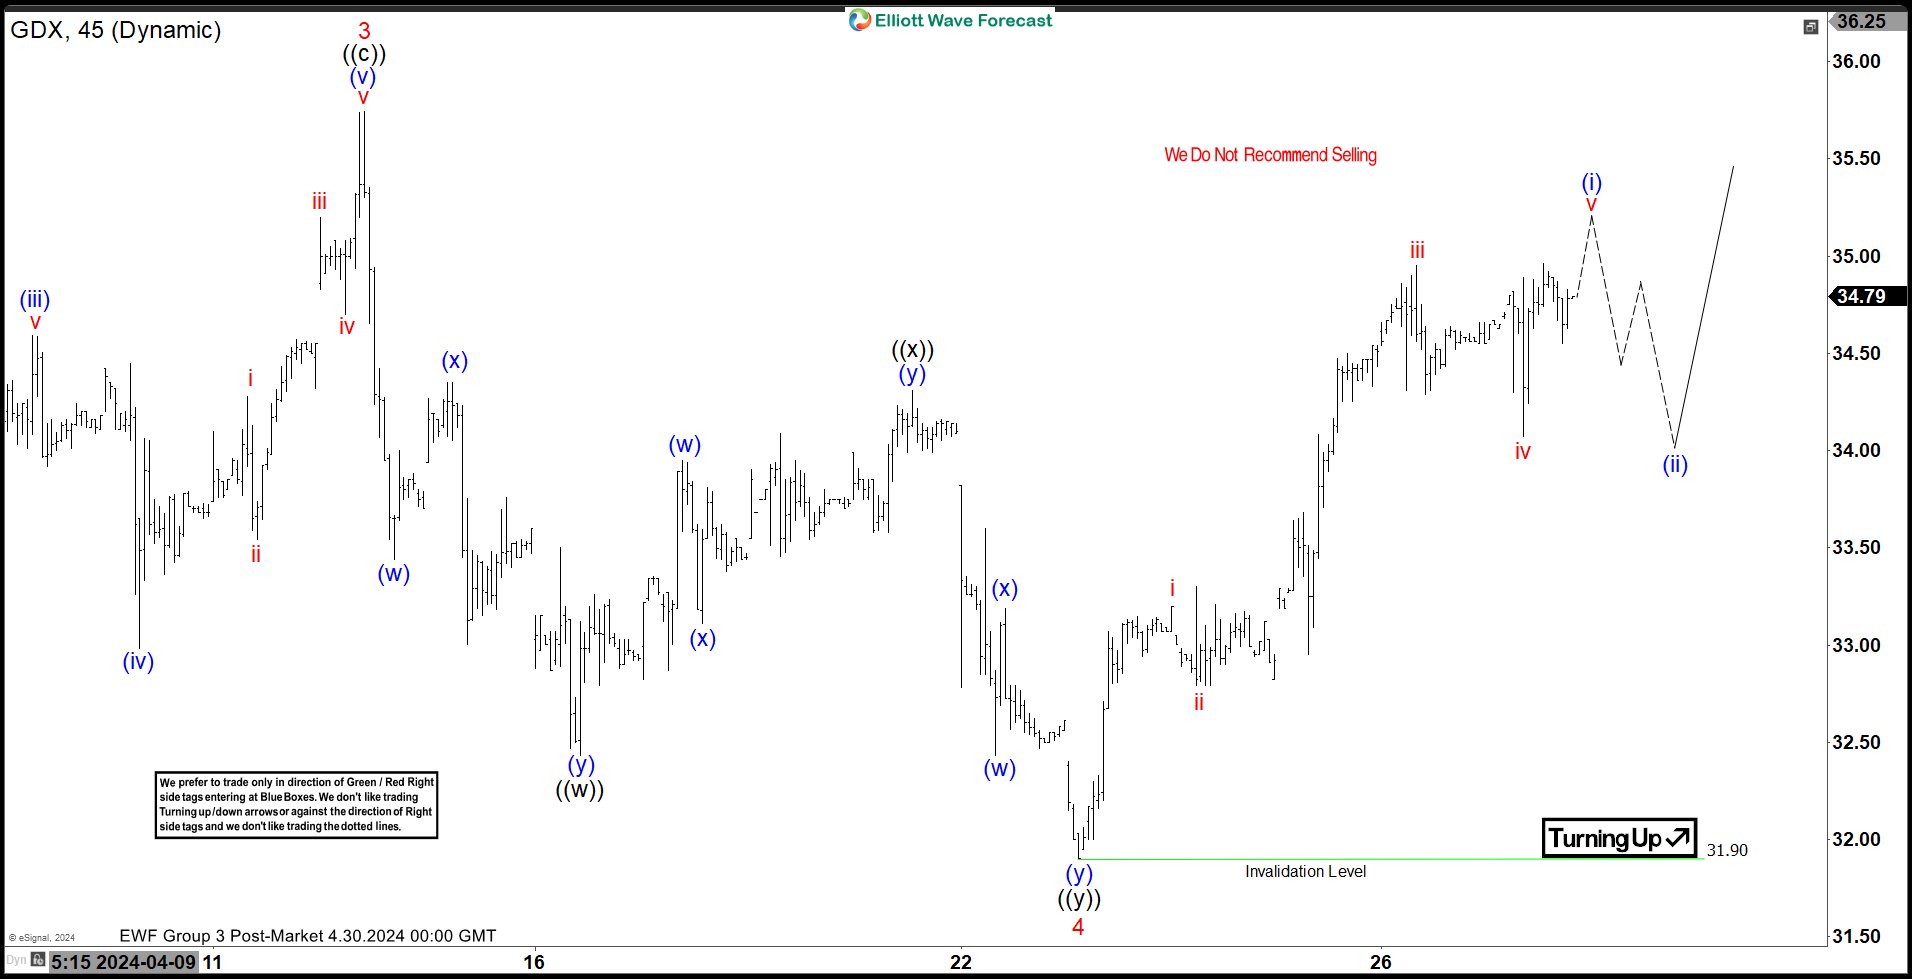
Short Term Elliott Wave View on GDX suggests that rally to 35.74 ended wave 3 on April 12, 2024. From there, the ETF pullback as a double three Elliott Wave structure. Down from wave 3, wave (a) ended at 33.44 and wave (b) ended at 34.35. Wave (c) lower ended at 32.43 which completed wave ((w)). The ETF then rallied in wave ((x)) as as a double three structure in lesser degree. Up from wave ((w)), wave (w) ended at 33.95 and wave (x) ended at 33.11. Wave (y) higher ended at 34.31 which completed wave ((x)).
The ETF then extended lower in wave ((y)) as a zigzag Elliott Wave structure. Down from wave ((x)), wave (a) ended at 32.78 and wave (b) ended at 33.60. Wave (c) lower ended at 31.90 which completed wave ((y)) of 4. The ETF has turned higher in wave 5. Up from wave 4, wave i ended at 33.3 and wave ii ended at 32.79. Wave iii higher ended at 34.95 and pullback in wave iv ended at 34.07. Expect the ETF to extend higher in wave v to complete wave (i). Afterwards, it should pullback in wave (ii) to correct cycle from 4.23.2024 low before it resumes higher. Near term, as far as pivot at 31.9 low stays intact, expect pullback to find support in 3, 7, 11 swing for further upside.
Source: https://elliottwave-forecast.com/news/elliott-wave-intraday-analysis-gdx-rally-expected/
The ETF then extended lower in wave ((y)) as a zigzag Elliott Wave structure. Down from wave ((x)), wave (a) ended at 32.78 and wave (b) ended at 33.60. Wave (c) lower ended at 31.90 which completed wave ((y)) of 4. The ETF has turned higher in wave 5. Up from wave 4, wave i ended at 33.3 and wave ii ended at 32.79. Wave iii higher ended at 34.95 and pullback in wave iv ended at 34.07. Expect the ETF to extend higher in wave v to complete wave (i). Afterwards, it should pullback in wave (ii) to correct cycle from 4.23.2024 low before it resumes higher. Near term, as far as pivot at 31.9 low stays intact, expect pullback to find support in 3, 7, 11 swing for further upside.
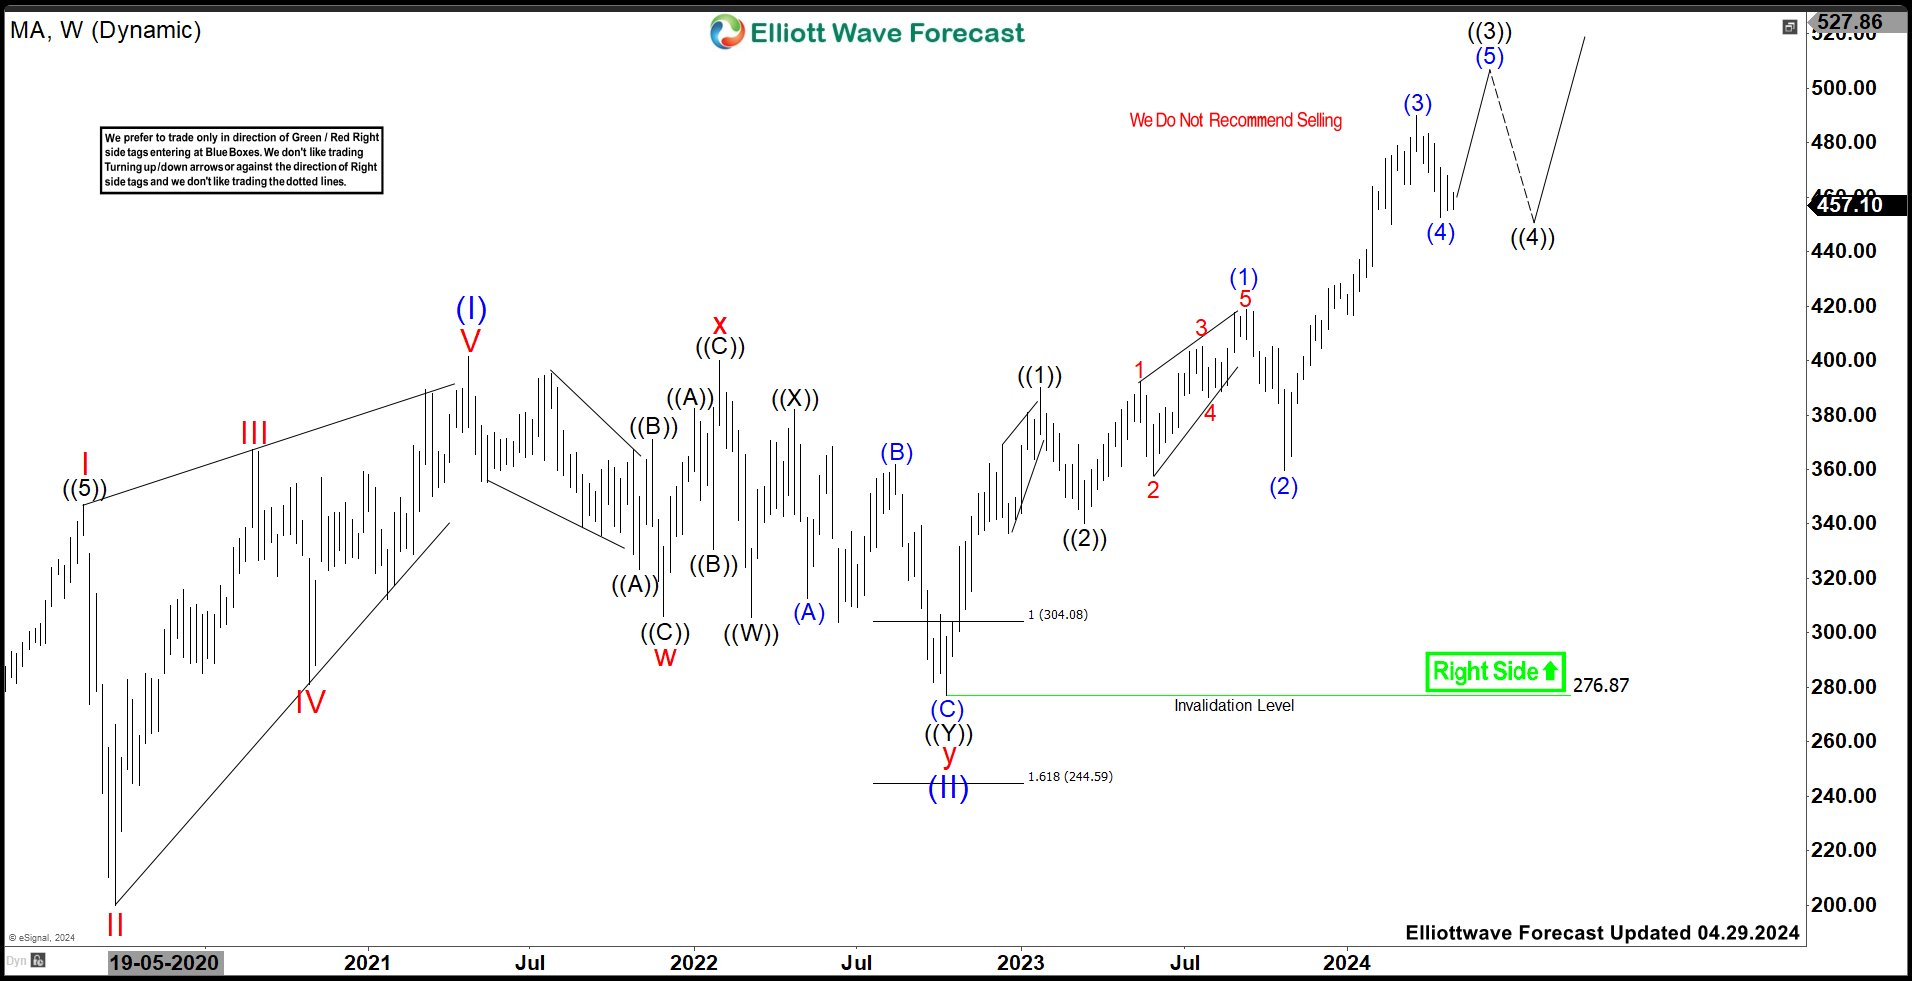


 Weekly Chart May 2024")


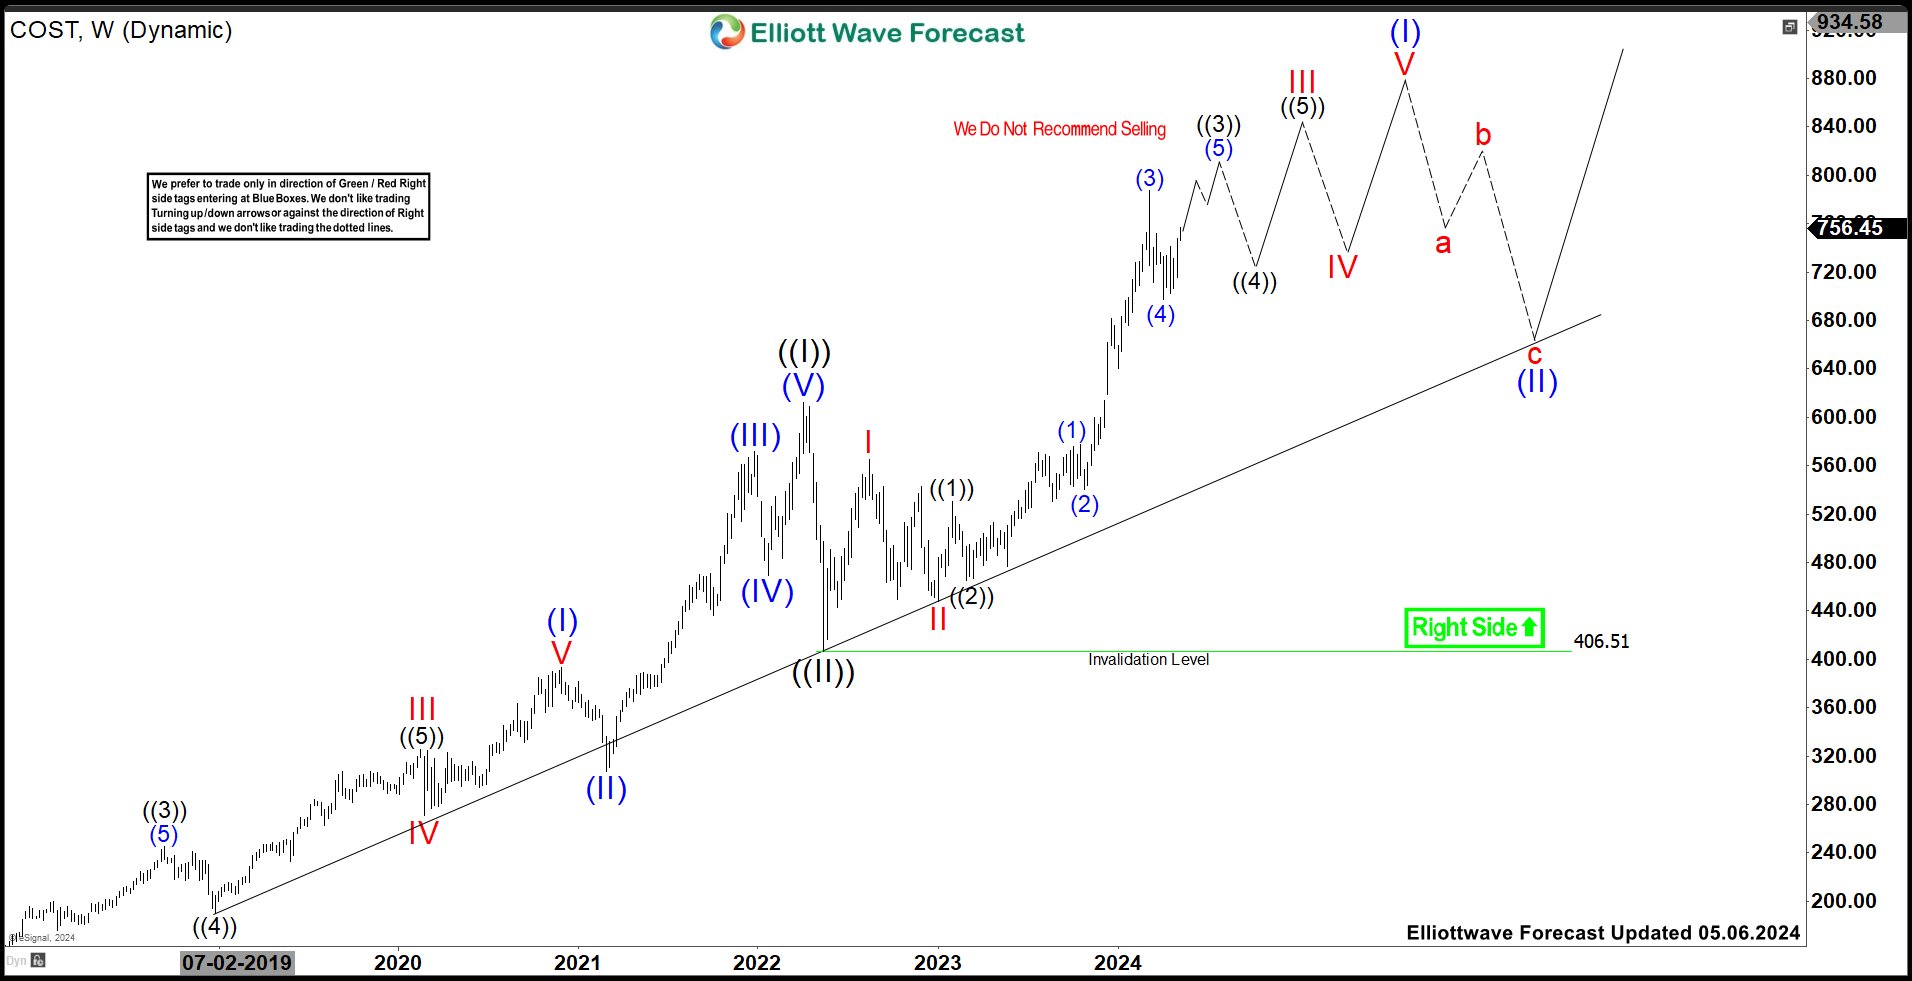
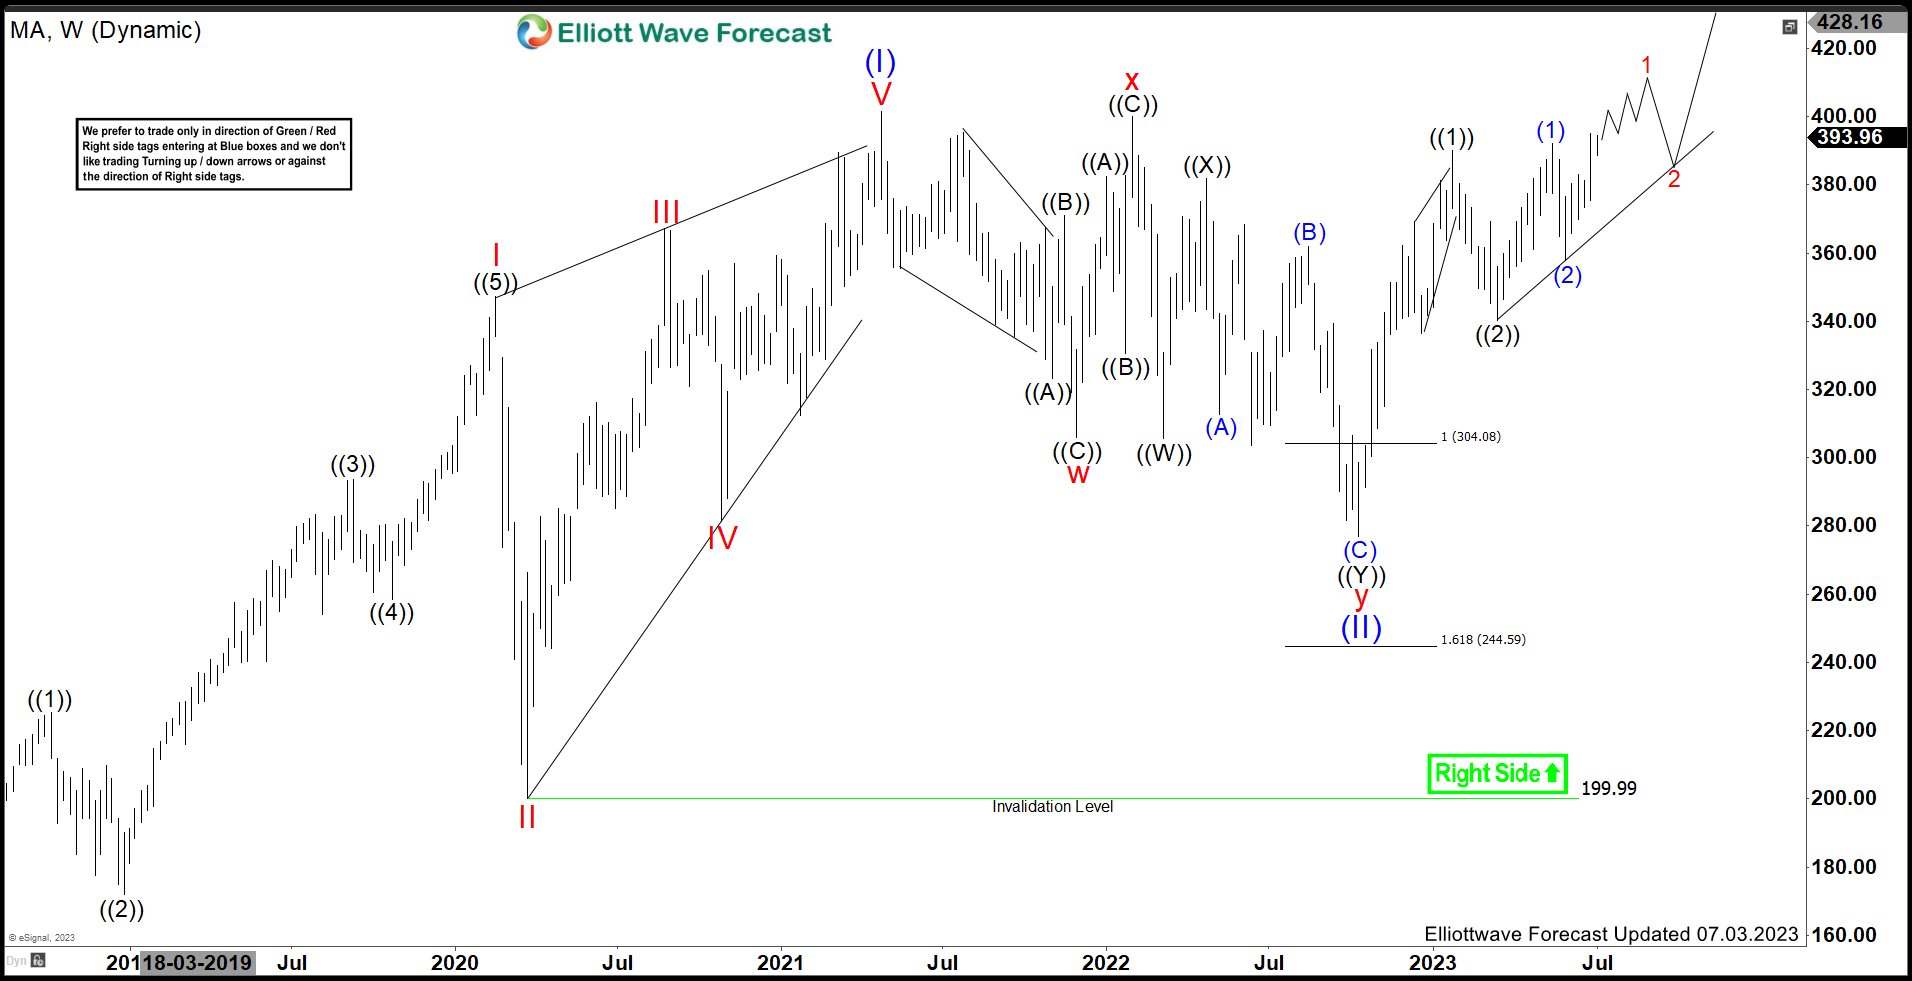
 Elliott Wave Chart")