Elliottwave-Forecast

Master Trader
Feb 17, 2017
2,466
9
84
www.elliottwave-forecast.com
Hello fellow traders. In this technical blog we’re going to take a quick look at the Elliott Wave charts of XLI ETF, published in members area of the website. As our members know we have been favoring the long side in XLI. Recently we got a pull back that has made a clear 3 waves pull back that found buyers right at the equal legs area. In the further text we are going to explain the Elliott Wave forecast

XLI H1 Post-Market Update 1.25.2023​

XLI ended cycle from the 109.9 low as 5 waves structure. The ETF is currently giving us pull back against the 109.9 low. Equal legs area is already reached at 112.38-111.54. We are aware that pull back can complete any moment. For now, we see possibility of a short term bounce in (iv) and then another marginal push down in (v) of ((c)) to complete the structure. We don’t recommend selling the ETF and expect further rally to resume from the buyers zone : 112.38-111.54.

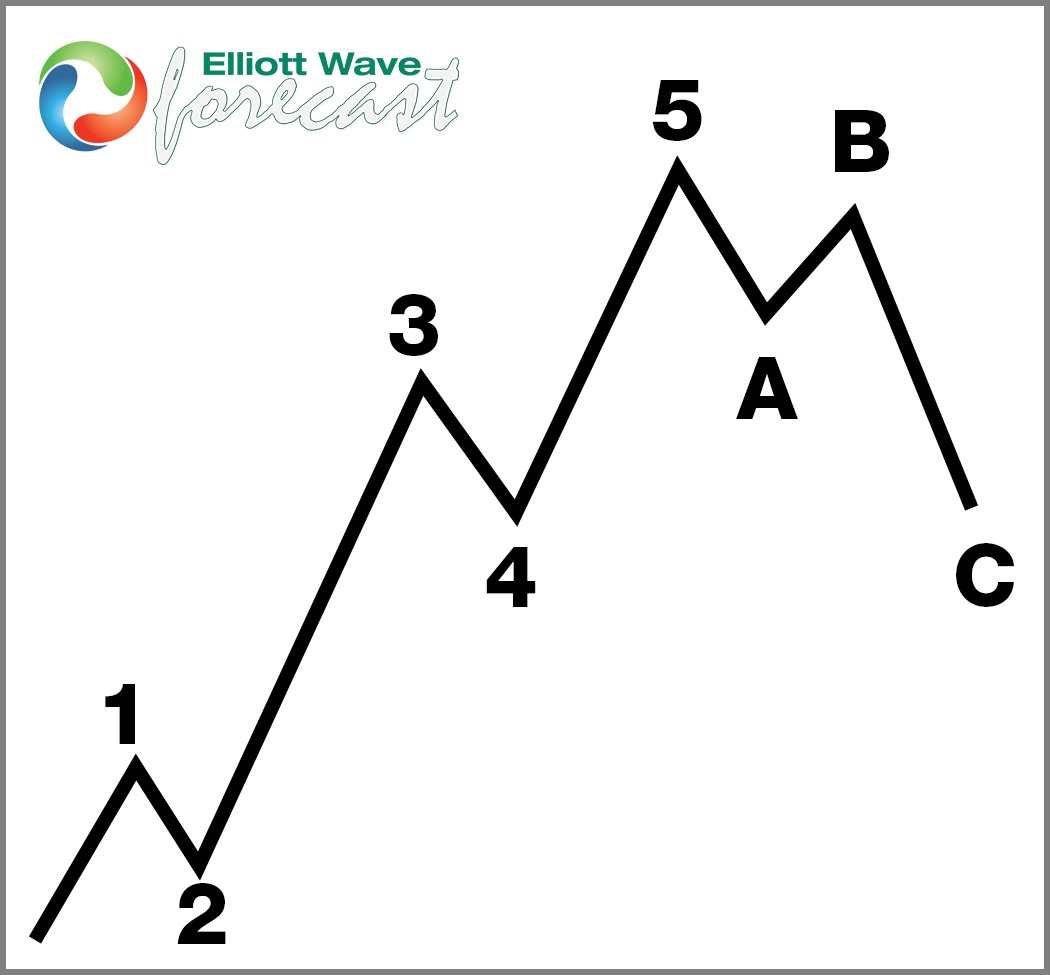
Reminder : You can learn more about Elliott Wave Patterns at our Free Elliott Wave Educational Web Page.

XLI

XLI H1 Post-Market Update 1.31.2023​

XLI has given us nice rally from the marked extreme zone as expected. We count wave 2 red completed at 112.36 low. Rally made a break toward new highs confirming next leg up wave 3 is in progress. We expect to get 3 waves pull back, wave ((ii)) black that can give us approximately 50-61.8 fibs against the 112.36 low before further rally resumes.

Keep in mind that market is dynamic and presented view could have changed in the mean time. You can check most recent updates in the membership area of the website. Remember that not every chart is trading recommendation. Best instruments to trade are those having incomplete bullish or bearish swings sequences. We put them in Sequence Report and best among them are shown in the Live Trading Room. You can check most recent charts in the membership area of the site.

XLI

Source: https://elliottwave-forecast.com/trading/xli-found-buyers-equallegs/
 

Elliottwave-Forecast

Master Trader
Feb 17, 2017
2,466
9
84
www.elliottwave-forecast.com
Hello everyone. In today’s article, we will look at the past performance of the 1 Hour Elliott Wave chart of Netflix Inc. ($NFLX). The rally from 1.17.2024 low at $476.01 unfolded as 5 waves impulse. So, we expected the pullback to unfold in 7 swings and find buyers again. We will explain the structure & forecast below:

Double Three (WXY) Corrective Structure​

$NFLX

$NFLX 1H Elliott Wave Chart 2.06.2024:​

$NFLXHere is the 1H Elliott Wave count from 2.06.2024. We expected the pullback to find buyers at the blue box area at 555.14 – 541.98 in a 7 swing structure (WXY).

$NFLX 1H Elliott Wave Chart 2.11.2024:​

$NFLXHere is the 1H update few days later from 2.11.2024 showing the bounce taking place as expected. The stock reacted higher from the blue box after doing a Double Three correction allowing longs to get a risk free position. The stock is expected to remain supported towards $588 – 600 before another pullback can happen.
Source: https://elliottwave-forecast.com/stock-market/netflix-inc-nflx-found-buyers-blue-box-area-expected/
 

Elliottwave-Forecast

Master Trader
Feb 17, 2017
2,466
9
84
www.elliottwave-forecast.com
Gilead Sciences, Inc. is an US American biopharmaceutical company. It focuses on researching and developing antiviral drugs used in the treatment of HIV/AIDS, hepatitis B, hepatitis C, influenza, and COVID-19, including ledipasvir and sofosbuvir. In the 2000s, Gilead received approval for drugs including Viread and Hepsera, among others. It began evolving from a biotechnology company into a pharmaceutical company, acquiring several subsidiaries, though it still relied heavily on contracting to manufacture its drugs. Founded in 1987 and headquartered in Foster City, California, US, Gilead Sciences is a part of Nasdaq-100 and S&P-100 indices. One can trade it under the ticker $GILD at NASDAQ.

Gilead Sciences Monthly Elliott Wave Analysis 02.11.2024​

The monthly chart below shows the Gilead Sciences shares $GILD traded at NASDAQ. From the IPO in 1992, the stock price has developed an initial cycle higher in blue wave (I) of super cycle degree towards 116.83 highs in October 2014. The impulsive structure higher shows an extended wave III. As a matter of fact, red wave III has surpassed 2.0x of the wave I. From the October 2014 highs, a correction lower in blue wave (II) has unfolded as an Elliott wave irregular flat pattern being 3-3-5 structure.

Firstly, red wave a of blue wave (II) has printed a low at $85.95 in December 2014. Then, a bounce has set an all-time high in June 2015. Later, from $123.37 highs, the price has broken $85.95 lows opening up next extension lower. It is the preferred view that red wave c has found an important bottom in December 2020. While above $56.56 lows, a new bullish cycle in blue wave (III) might have started and is now in the initial stages. The target for blue wave (III) will be 173-245 area and even higher.

In shorter cycles, red wave I of blue wave (III) might be in progress. It is unfolding as a leading diagonal pattern being 5-3-5-3-5 structure. Within it, waves ((1))-((3)) have ended already. Currently, pullback in black wave ((4)) is taking place and should find support in 7 swings against June 2022 lows. Then, next leg higher in black wave ((5)) should complete the structure of red wave I. Following pullback in red wave II should see support in 3, 7 swings against December 2020 lows for an acceleration higher in red wave III of blue wave (III).

Gilead Elliott Wave Monthly

Gilead Sciences Daily Elliott Wave Analysis 02.11.2024​

The daily chart below shows in more detail the advance in black wave ((3)) and a pullback in black wave ((4)). From the June 2022 lows, black wave ((3)) of red wave I has ended in December 2022. It has the pattern of an impulse which is the most typical characteristics of the 3rd waves. From the 89.74 highs, correction in wave ((4)) is taking place. Hereby, the consolidation unfolds as a double three pattern. Firstly, from the December 2022 highs, 3 swings of blue (W) have set a low at $72.87 in October 2023. Secondly, a bounce in blue wave (X) has printed a connector high at $87.86. Now, $GILD has broken $72.87 lows opening up a bearish sequence. Blue wave (Y) should reach in 3 swings towards 71.04-60.62 area. From the bluebox area, expect another leg higher in black wave ((5)). The target will be 94.13-101.27 area and possibly higher.

Investors and traders can be using 71.04-60.62 bluebox area as a buying opportunity in $GILD targeting 94.13-101.27 area and higher in short-term and 173-245 area and beyond in the long run.

Gilead Elliott Wave Daily

Source: https://elliottwave-forecast.com/video-blog/gilead-daily-buying-area/
 

Elliottwave-Forecast

Master Trader
Feb 17, 2017
2,466
9
84
www.elliottwave-forecast.com
Johnson & Johnson (JNJ) is an American multinational corporation founded in 1886 that develops medical devices, pharmaceuticals, and consumer packaged goods. Its common stock is a component of the Dow Jones Industrial Average, and the company is ranked No. 36 on the 2021 Fortune 500 list of the largest United States corporations by total revenue.

JNJ Daily Chart October 2023

JNJ Daily Chart October 2023

In the last analysis, we called 3 waves more to the downside to end a double correction structure ((W)), ((X)), ((Y)). The stock reacted lower from a blue box area ending wave ((X)) and starting wave ((Y)). Then we expected to finish a wave (A) as a leading diagonal, bounce in wave (B) and continuing lower in (C). As price actions stays below 175.97 high, we are looking to keep lower prices.

JNJ Daily Chart February 2024


Down from 175.97 high, JNJ ended wave A at 157.35 low and wave B made a running flat correction completing at 159.27 high. Then, market continued lower to end the first 3 swings of a double correction at 144.95 low as wave C of (W) and wave (W). The stock rallied since late October 2023 starting connector (X) pullback. It built a leading diagonal structure finishing wave A at 163.58 high and actually JNJ is developing wave B correction. This wave B could complete in 152 - 149 area and the market should break higher in wave C to end wave (X) before resuming to the downside again.

Source: https://elliottwave-forecast.com/stock-market/johnson-jnj-bearish-sequence-bull-trap/
 

Elliottwave-Forecast

Master Trader
Feb 17, 2017
2,466
9
84
www.elliottwave-forecast.com
XPO INC., (XPO) provides freight transportation services in United States, rest of North America, Europe, UK & internationally. It operates in two segments, North American LTL & European Transportation & offers services to different industries. It is based in Greenwich, CT, comes under “Industrials” sector & trades as “XPO” ticker at NYSE. It is having 13.65 B$ market cap on 12-February-2024.

XPO is trading at ATH in impulse sequence in (3) of ((3)) of III of (III). It expects to remain supported in 3, 7 or 11 swings pullback to resume higher, which may provide trading opportunity.

XPO - Elliott Wave Latest Weekly View:

It placed (II) at $13.30 low in weekly sequence in 2020 low & II of (III) at $24.75 low in 2022 low. Above there, it favors upside in ((3)) of III & remain supported, while dips remain above $65.80 low. It placed ((1)) of III at $80.42 high & ((2)) at $65.80 low as shallow correction. Within ((1)), it placed (1) at $45.06 high, (2) at $29.02 low, (3) at $76.77 high, (4) at $67.21 low & finally ended (5) at $80.42 high as ((1)). It ended ((2)) as 0.236 Fibonacci retracement of ((1)) before resumes higher in ((3)).

XPO - Elliott Wave Latest Daily View:

Above ((2)) low of $65.80, it placed favors upside in 3 of (3) of ((3)). It placed (1) at $90.78 high & (2) at $78.72 low. Within (3) of ((3)), it placed 2 at $80.26 low & favors upside in ((iii)) of 3, while ended ((ii)) at $82.78 low. It expects one more push higher to finish ((iii)) of 3 soon before correcting in ((iv)). It expects to remain supported in the series of third and fourth waves to extend higher as the part of ((3)) of III, which can extend between $121.48 - $155.91 area. We like to buy the pullback in 3, 7 or 11 swigs pullback at extreme areas, when reached.

Source: https://elliottwave-forecast.com/stock-market/xpo-continue-rally-in-bullish-sequence/
 

Elliottwave-Forecast

Master Trader
Feb 17, 2017
2,466
9
84
www.elliottwave-forecast.com
In this technical blog, we will look at the past performance of the 4-hour Elliott Wave Charts of CHFJPY. In which, the rally from 14 December 2023 low unfolded as an impulse sequence and called for an extension higher to take place. Therefore, we knew that the structure in CHFJPY should remain supported & extend higher. So, we advised members not to sell the pair & buy the dips in 3, 7, or 11 swings at the blue box areas. We will explain the structure & forecast below:

CHFJPY 4-Hour Elliott Wave Chart From 2.06.2024​

CHFJPY Perfectly Reacting Higher From Blue Box Area

Here’s the 4-hour Elliott wave Chart from the 2/06/2024 update. In which, the rally to 171.82 high-ended wave (1) & made a pullback in wave (2). The internals of that pullback unfolded as Elliott wave zigzag correction where wave A ended in 3 swings at 169.64 low. Then a bounce to 171.48 high-ended wave B & started the next leg lower in wave C towards 169.26- 167.89 blue box area. From there, buyers were expected to appear looking for new highs ideally or for a 3-wave bounce minimum.

CHFJPY Latest 4-Hour Elliott Wave Chart From 2.12.2024​

CHFJPY Perfectly Reacting Higher From Blue Box Area

This is the latest 4-hour Elliott wave Chart from the 2/12/2024 update. In which the pair is showing a reaction higher taking place, right after ending the correction within the blue box area. Allowed members to create a risk-free position shortly after taking the long position at the blue box area. However, a break above 171.82 high is still needed to confirm the next extension higher & avoid further correction lower.

Source: https://elliottwave-forecast.com/forex/chfjpy-perfectly-reacting-higher-blue-box/
 

Elliottwave-Forecast

Master Trader
Feb 17, 2017
2,466
9
84
www.elliottwave-forecast.com
Visa Inc (NYSE: V) is an American multinational payment card services corporation headquartered in San Francisco, California. It facilitates electronic funds transfers throughout the world, most commonly through Visa-branded credit cards, debit cards and prepaid cards. This article dives into the potential technical trajectories within its weekly cycle using Elliott Wave Theory.

In November 2023, Visa stock surged into new all time highs after breaking above 2021 peak. The move created a weekly bullish sequence and it will be looking for a higher target at least toward equal legs area $425 - $581.

The Initial rally from October 2022 low is proposed to unfold as a bullish nest within wave I of (III). The rally within the 3rd wave usually has the strongest momentum within a regular impulse. The price action is more supported to the upside while pullbacks are short-lived because buyers will keep entering the market after 3 , 7 or 11 swings as long as the trend stays intact.

The stock will continue the rally within a series of 4th & 5th waves until it finish the 5 waves advance within wave I. After ending that cycle, a correction within wave II will take place presenting a potential new investment opportunity to join the weekly bullish trend as the stock is still proposed to be rallying within wave (III).

The weekly bullish sequence will support Visa in the coming years therefore investors are advised to keep an eye for the daily corrective pullbacks to be able to join then bullish trend.

V Weekly Chart 2.13.2024​

Visa V Weekly 2.13.2024

Source: https://elliottwave-forecast.com/stock-market/visa-v-signals-upside/
 

Elliottwave-Forecast

Master Trader
Feb 17, 2017
2,466
9
84
www.elliottwave-forecast.com
NextGen Energy ($NXE) is a Canadian uranium exploration and development company focused on advancing its high-grade Arrow deposit in the Athabasca Basin in Saskatchewan. With a robust portfolio of uranium assets and a strong emphasis on sustainable development, NXE is poised to play a significant role in the global transition to clean energy, particularly as nuclear power gains momentum as a low-carbon energy source.

In our previous article, we wrote that NextGen Energy was ready for the the next leg higher in coming years. Below is what the weekly chart we posted in September 2022 looking for a rally higher in years to come.

$NXE Weekly Elliott Wave Chart from September 2022​


$NXE Weekly Elliott Wave Chart - Latest Update as of February 14, 2024​


Above is the latest weekly chart of NextGen Energy where we can see the stock did rally higher as expected in the past 1+ years. Up from wave (II) low, wave I ended at 6.50 and pullback in wave II ended at 3.39. The stock then resumed higher in wave III. Expect the stock to continue to extend higher in years to come.

$NXE Daily Elliott Wave Chart - Latest Update as of February 14, 2024​


Daily Elliott Wave Chart of NextGen Energy (NXE) above shows that the stock ended wave (2) on 4.35.2023 at 3.59. It then resumed higher in wave (3) which completed at 8.31. Wave (4) pullback is in progress in 3, 7, or 11 swing to correct rally from 4.25.2023 low before it resumes higher. Near term, as far as pivot at 3.59 low stays intact, expect pullback to find support in 3, 7, 11 swing for further upside.

Source: https://elliottwave-forecast.com/st...-nxe-pullback-should-continue-to-find-buyers/
 

Elliottwave-Forecast

Master Trader
Feb 17, 2017
2,466
9
84
www.elliottwave-forecast.com
Hello everyone. In today’s article, we will look at the past performance of the 1 Hour Elliott Wave chart of Health Care Select Sector ($XLV). The rally from 1.25.2024 low at $137.21 unfolded as 5 waves impulse. So, we expected the pullback to unfold in 7 swings and find buyers again. We will explain the structure & forecast below:

Double Three (WXY) Corrective Structure​

$NFLX

$XLV 1H Elliott Wave Chart 2.13.2024:​

$XLVHere is the 1H Elliott Wave count from 2.13.2024. We expected the pullback to find buyers at the blue box area at 142.56 – 141.39 in a 7 swing structure (WXY).

$XLV 1H Elliott Wave Chart 2.16.2024:​

$XLVHere is the 1H update few days later from 2.16.2024 showing the bounce taking place as expected. The ETF reacted higher from the blue box after doing a Double Three correction allowing longs to get a risk free position. The stock is expected to remain supported towards $156 – 168 before another pullback can happen.
Source: https://elliottwave-forecast.com/st...ctor-xlv-found-buyers-blue-box-area-expected/
 

Elliottwave-Forecast

Master Trader
Feb 17, 2017
2,466
9
84
www.elliottwave-forecast.com
Hello fellow traders. In this technical article we’re going to take a quick look at the Elliott Wave charts of BABA Stock published in members area of the website. As our members know, the stock has recently made a recovery that found sellers right at the blue box area. Our team recommended members to avoid buying the stock , while keep favoring the short side. BABA found sellers and made reaction from the blue box as expected. In the further text we are going to explain the Elliott Wave Forecast and trading strategy.

BABA Elliott Wave 4 Hour Chart 02.06.2024​

BABA is currently giving us (4) blue recovery which is unfolding as Elliott Wave Zig Zag Pattern. The price structure looks incomplete at the moment. We expect to see more short term strength toward 80.13-85.77 equal legs ( Blue Box – sellers zone). We don’t recommend buying the stock and prefer the short side from the blue box. As the main trend is bearish, we expect to see at least 3 waves pull back from our selling zone. Once decline reaches 50 Fibs against the B red low , we will make short position risk free ( put SL at BE) and take partial profits. Invalidation for the short trades is break above 1.618 fib ext : 85.77

Quick reminder:

Our charts are easy to trade and understand:
Red bearish stamp+ blue box = Selling Setup
Green bullish stamp+ blue box = Buying Setup
Charts with Black stamps are not tradable.

You can learn more about Elliott Wave Patterns at our Free Elliott Wave Educational Web Page.

baba

BABA Elliott Wave 4 Hour Chart 02.15.2024​

The stock found sellers right at the Blue Box area : 80.13-85.77 . Recovery completed at the 82.7 high and we got good reaction from the selling zone. Decline reached and exceeded 50 fibs against the connector’s low. So members who took the short trades are enjoying profits now in a risk free positions. While below 82.7 high, next leg down can be in progress toward new lows.

Keep in mind that market is dynamic and presented view could have changed in the mean time. You can check most recent charts in the membership area of the site. Best instruments to trade are those having incomplete bullish or bearish swings sequences. We put them in Sequence Report and best among them are shown in the Live Trading Room

Baba

Source: https://elliottwave-forecast.com/trading/baba-elliott-wave-stock-blue-box/
 

Elliottwave-Forecast

Master Trader
Feb 17, 2017
2,466
9
84
www.elliottwave-forecast.com
BlackRock (NYSE: BLK) is the world's largest asset manager, with $9.42 trillion in assets as of June 30, 2023. Headquartered in New York City, Blackrock has 70 offices in 30 countries, and clients in 100 countries. In this article, we will be taking a look at the technical structure for the stock based on the Elliott Wave Theory and we'll define the pth within current cycles.

Following the 48% decline in 2022, BLK established a major low in October 2022 with the rest of the stock market. The corrective 3 waves decline from 2021 peak is proposed to be a wave (II) pullback and consequently the stock is getting ready for the next leg to the upside within wave (III).

BLK initially rallied within an impulsive 5 waves advance in wave I then it did 3 waves pullback in wave II. Up from October 2023, the stock managed to break above wave I peak and that move created a higher high sequence within daily cycle. Following this move, the stock is looking to remain supported above $503 and will be looking to extend higher at least toward $880 and extension can take it toward $990 which will be the key event after a break into new all time highs.

The break above November 2021 peak will be the key within the weekly cycle to establish a higher high sequence following the higher low of 2022. Consequently, investors will expect the stock to see more upside in the coming years and will be looking to buy into pullbacks in 3 , 7 or 11 swings.

BLK Weekly Chart 2.19.2024​

BLK Weekly

Source: https://elliottwave-forecast.com/video-blog/blackrock-blk-bullish-sequence/
 

Elliottwave-Forecast

Master Trader
Feb 17, 2017
2,466
9
84
www.elliottwave-forecast.com
JPMorgan Chase & Co. (JPM) is an American multinational investment bank and financial services holding company headquartered in New York City and incorporated in Delaware. As of December 31, 2021, JPMorgan Chase is the largest bank in the United States, the world's largest bank by market capitalization, and the fifth-largest bank in the world in terms of total assets, with total assets totaling to US$3.831 trillion.

JPM Daily Chart June 2023

JPM Daily Chart June 2023

In June 2023 update, we showed a cycle ended as wave ((2)) near to a blue box at 101.22. Then, we can see how price action built 5 waves higher to end the leading diagonal at $144.34 as wave 1. Then, it developed a flat correction 3-3-5, where wave ((c)) was a clear ending diagonal to finish wave 2 at $123.11. After this, the market continued to the upside and we called that the stock should continue with this trend until completing another impulse as wave ((i)) before seeing 3, 7 or 11 swings correction as wave ((ii)).

JPM Daily Chart October 2023

JPM Daily Chart October 2023

In October 2023, the market continued higher as expected and it ended wave ((i)) at 159.38. Then, the price action developed clearly 3 swings lower where wave (b) was a flat correction and it should keep dropping to 134.59 - 130.20 area to end wave ((ii)) before turning higher again.

JPM Daily Chart February 2024


Actually, the wave ((ii)) ended at 135.19 missing the minimum target of 134.59 for 60 cents. JPM rallied stronger continued with the impulse structure. Wave ((iii)) completed at 176.31 high and pullback as wave ((iv)) ended at 164.30 low. As price action stays above this level, we are looking for more upside to complete wave ((v)). This wave ((v)) also will end wave 3 and the stock should enter in a wave 4 correction. The wave 4 could retest around 164.30 low and then continuing with the rally.

Source: https://elliottwave-forecast.com/stock-market/jpmorgan-jpm-rallied-avoiding-crash/
 

Elliottwave-Forecast

Master Trader
Feb 17, 2017
2,466
9
84
www.elliottwave-forecast.com
Platinum (PL) is still in the process of forming a bottom and the metal is trading sideways since 2021 peak at 1348.2. The metal still needs to break above 1348.2 to confirm that the next leg higher has started. Below we updated the Monthly and Daily Elliott Wave chart for the metal.

Platinum (PL) Monthly Elliott Wave Chart​

Monthly chart of Platinum above shows that the metal ended wave ((II)) at 562. The rally from there is in progress as a nesting impulse Wave (I) of ((III)) ended at 1348.2 and dips in wave (II) of ((III)) is proposed complete at 796.8. Up from wave (II), the metal is nesting with wave ((1)) ended at 1148.9. Dips in wave ((2)) might have ended at 843.1. While above 843.1, the metal can see further upside.

Platinum (PL) Daily Elliott Wave Chart​


Daily chart of Platinum above shows that the metal ended wave (II) at 796.8. Up from wave (II), wave ((1)) ended at 1148.9 and wave ((2)) pullback ended at 843.1. It is then nesting higher with wave (1) ended at 1016. Near term, while above 796.8, expect the metal to extend higher.

Source: https://elliottwave-forecast.com/commodities/platinum-pl-bottoming-process/
 

Elliottwave-Forecast

Master Trader
Feb 17, 2017
2,466
9
84
www.elliottwave-forecast.com
Eli Lilly & Company (LLY) discovers, develops & markets human pharmaceuticals worldwide. It is having around 742 B$ market cap as on 16-February, 2024. It is based in Indianapolis, Indiana, US, comes under Healthcare sector & trades as “LLY” ticket at NYSE.

LLY react higher as expected from previous article, favoring further upside in ((3)) of III in impulse sequence. It favors upside in 3 of (3) & remain supported in 3, 7 or 11 swings pullback to resume rally in extended wave ((3)).

LLY - Elliott Wave Weekly View From 8.14.2023:

In Weekly sequence, it finished II of (III) at $101.36 low in October-2019. It favors higher in third wave extension in III & favors upside in (3) of ((3)) of III towards $869.47 or higher levels. It placed ((1)) at $375.25 high in December-2022 & ((2)) at $309.20 low in March-2023. Within ((1)), it finished (1) at $170.75 as diagonal structure & (2) at $129.21 low as 0.618 Fibonacci retracement. It placed (3) at $335.33 high, (4) at $296.32 low & (5) at $375.25 high.

LLY - Elliott Wave Latest Weekly View:

Above ((2)) low, it ended (1) of ((3)) at $629.97 high & (2) at $547.61 low as 0.236 Fibonacci retracement. Within (1), it placed 1 at $469.87 high, 2 at $434.34 low, 3 at $601.84 high, 4 at $516.57 low & 5 as (1) at $629.97 high. It broke above (1) in January-2024, confirmed upside to be (3) of ((3)). It expects (3) of ((3)) to extend towards $869.47 or higher levels before correcting in (4). We like to buy the pullback in 3, 7 or 11 swings at extreme areas, when reached.

Source: https://elliottwave-forecast.com/stock-market/lly-continue-bullish-rally/
 

Elliottwave-Forecast

Master Trader
Feb 17, 2017
2,466
9
84
www.elliottwave-forecast.com
Hello fellow traders. In this technical article we’re going to take a look at the Elliott Wave charts charts of NASDAQ Futures published in members area of the website. As our members know NASDAQ has recently made pull back that has unfolded as Elliott Wave Zig Zag pattern. It made clear 3 waves down from the February 12th peak and completed correction right at the Equal Legs zone ( Blue Box Area) . In further text we’re going to explain the Elliott Wave pattern and trading setup.

NASDAQ Elliott Wave 1 Hour Chart 02.20.2024​

NASDAQ has made 5 waves down from the peak, suggesting we have potentially ended only first leg of the correction that is unfolding as a Elliott Wave Zig Zag pattern. Correction has (a)(b)(c) labeling. The price structure is incomplete at the moment, calling for a more downside in near term toward : 17454.3-17099.2. We don’t recommend selling NASDAQ and prefer the long side from the marked Blue Box ( buying zone). Once NQ_F reaches our buying area, it should ideally make either rally toward new highs or in 3 waves bounce alternatively. Once bounce reaches 50 Fibs against the (b) blue high, we will make long position risk free ( put SL at BE) and take partial profits.

Official trading strategy on How to trade 3, 7, or 11 swing and equal leg is explained in details in Educational Video, available for members viewing inside the membership area.

Quick reminder on how to trade our charts :

Red bearish stamp+ blue box = Selling Setup
Green bullish stamp+ blue box = Buying Setup
Charts with Black stamps are not tradable.

NASDAQ

NASDAQ Elliott Wave 1 Hour Chart 02.22.2024​

NASDAQ made extension toward our buying zone at : 17454.3-17099.2 as we expected. NQ futures found buyers at the blue box and we are getting very good reaction from there. Bounce already reached 50 fibs against the (b) blue connector which confirms cycle from the peak is done. Consequently, any long positions from the equal legs area should be risk free by now. As far as the price stays above 17372.7 low, we can see further strength in NASDAQ targeting 18306 area ideally.

Keep in mind that market is dynamic and presented view could have changed in the mean time. You can check most recent charts with target levels in the membership area of the site. Best instruments to trade are those having incomplete bullish or bearish swings sequences. We put them in Sequence Report and best among them are shown in the Live Trading Room

New to Elliott Wave ? Check out our Free Elliott Wave Educational Web Page and download our Free Elliott Wave Book.


Source: https://elliottwave-forecast.com/trading/nasdaq-elliott-wave-buying-blue-box/
 

Elliottwave-Forecast

Master Trader
Feb 17, 2017
2,466
9
84
www.elliottwave-forecast.com
URA is a Uranium ETF that tracks the performance of companies involved in the uranium industry globally. It provides investors with diversified exposure to uranium mining, exploration, and production companies, offering a convenient way to invest in this sector. Below we will take a look at the Elliott Wave outlook for the ETF.

$URA Elliott Wave Chart Monthly Chart​


Monthly Elliott Wave Chart of Uranium ETF (ETF) above shows that the ETF ended wave ((II)) at 6.95. The ETF then starts a new bullish cycle in wave ((III)). Up from wave ((II)), wave I ended at 31.60 and pullback in wave II ended at 17.65. The ETF has now extended higher in wave III. Above wave II, wave (1) ended at 24.34 and dips in wave (2) ended at 18.31. Up form there, wave (3) ended at 32.60. Expect pullback in wave (4) followed by wave (5) higher to end wave ((1)) in higher degree. Afterwards, it should pullback in wave ((2)) in 3, 7, 11 swing before it resumes higher.

$URA Daily Elliott Wave Chart​

Uranium ETF (URA) Elliott Wave Chart

In Daily Elliott Wave Chart of $URA above, the ETF has ended wave (2) at 18.33 and extended higher in wave (3). Up from wave (2), wave 1 ended at 21.12 and pullback in wave 2 ended at 18.97. The ETF extended higher in wave 3 towards 28.42 and dip sin wave 4 ended at 24.45. Final leg wave 5 ended at 32.60 which completed wave (3). Pullback in wave (4) is in progress and can reach 23.1 - 25.5 area before finding buyers.

Source: https://elliottwave-forecast.com/news/uranium-etf-ura-correction-progress/
 

Elliottwave-Forecast

Master Trader
Feb 17, 2017
2,466
9
84
www.elliottwave-forecast.com
Hello fellow traders. In this technical blog we’re going to take a quick look at the Elliott Wave charts of QQQ ETF , published in members area of the website. As our members know the ETF is showing impulsive bullish sequences in the cycle from the 254.07 low. Consequently , we were calling for the further rally in QQQ. Recently we got a pull back that has had a form of Elliott Wave Zig Zag pattern. In the further text we are going to explain the Elliott Wave Pattern and the trading strategy.

Before we take a look at the real market example, let’s explain Elliott Wave Zigzag.

Elliott Wave Zigzag is the most popular corrective pattern in Elliott Wave theory . It’s made of 3 swings which have 5-3-5 inner structure. Inner swings are labeled as A,B,C where A =5 waves, B=3 waves and C=5 waves. That means A and C can be either impulsive waves or diagonals. (Leading Diagonal in case of wave A or Ending in case of wave C) . Waves A and C must meet all conditions of being 5 wave structure, such as: having RSI divergency between wave subdivisions, ideal Fibonacci extensions and ideal retracements.

If you are new to Elliott Wave we recommend you to check out our Free Elliott Wave Educational Web Page and download our Free Elliott Wave Book.

QQQ

QQQ Elliott Wave 1 Hour Chart 02.20.2024​

The ETF is currently giving us correction, wave 2 red pull back. Decline from the peak has a form of 5 waves, so we assume we got only the first leg of correction that is unfolding as Elliott Wave Zig Zag Pattern. That means both ((a)) and ((c)) legs should have 5 waves structures. We expect to see another leg down:((c)) black that will have a form of 5 waves. The ETF should ideally trade lower toward Equal legs area 423.53-415.00 ( Buying zone)

Reminder : You can learn more about Zig Zag and other Elliott Wave Patterns at our Free Elliott Wave Educational Web Page.


QQQ

QQQ Elliott Wave 1 Hour Chart 02.21.2024​

QQQ reached equal legs zone as expected. Another low would be ideal to complete 5 waves in ((c)) wave. We don't recommend selling and favor the long side from the Blue Box : 423.53-415.00 area. As the main trend is bullish , we expect to get rally toward new highs ideally or 3 waves bounce at least. Once bounce reaches 50 Fibs against the ((b)) black high, we will make long position risk free ( put SL at BE) and take partial profits.

Official trading strategy on How to trade 3, 7, or 11 swing and equal leg is explained in details in Educational Video, available for members viewing inside the membership area.

Quick reminder:

Our charts are easy to trade and understand:
Red bearish stamp+ blue box = Selling Setup
Green bullish stamp+ blue box = Buying Setup
Charts with Black stamps are not tradable.

You can learn more about Elliott Wave Patterns at our Free Elliott Wave Educational Web Page.

QQQ

QQQ Elliott Wave 1 Hour Chart 02.21.2024​

The ETF found buyers at the blue box and we got very good reaction from there. Consequently, any long positions from the equal legs area should be risk free by now. QQQ is now bullish against the 421.68 pivot. We expect ETF to keep finding buyers in intraday dips.

Keep in mind that market is dynamic and presented view could have changed in the mean time. You can check most recent charts with target levels in the membership area of the site. Best instruments to trade are those having incomplete bullish or bearish swings sequences. We put them in Sequence Report and best among them are shown in the Live Trading Room

New to Elliott Wave ? Check out our Free Elliott Wave Educational Web Page and download our Free Elliott Wave Book.

QQQ

Source: https://elliottwave-forecast.com/elliottwave/qqq-buying-elliott-wave-zig-zag/
 

Elliottwave-Forecast

Master Trader
Feb 17, 2017
2,466
9
84
www.elliottwave-forecast.com
Hello Traders. In today’s article, we are going to follow up on AbbVie Inc. ($ABBV) forecast that was posted back in July 2023 and take a look at the latest count.

$ABBV Daily Elliott Wave View July 2023:​

ABBV-Daily20230703113408.jpg


Our remarks from July 2023 were as follows:

"The Daily chart above shows the cycle from April 2022 peak unfold in a double three (WXY) corrective structure. The stock should be at the tail end of the correction towards the Blue Box area at $126.39 – 100.60 where buyers are expected to appear and start the next cycle higher. Although, we like it lower right now towards the blue box, traders should not be short selling the last swing lower as truncations can happen at this stage of the market."

Double Three (WXY) Corrective Structure​

$ABBV

$ABBV Latest Elliott Wave View Feb 2024:​

$ABBVThe Daily Chart above shows the latest view which ended up seeing the correction end with a truncation before reaching the blue box area. The stock rallied in a 5 wave impulse after finding buyers on 6.28.2023 at $130.96. Once the 5 wave advance ended, a 3 swing pullback (ABC) took place to correct it and was met with buyers. The strong reaction from there has made new ATHs and erased divergence in all timeframes making it the wave 3 of 3 of a nest. The stock is expected to remain supported in a series of 4s and 5s with a target higher towards $186 – 204 before the cycle from June 2023 low ends. Once that cycle ends, we expect the pullback to correct June 2022 to also find buyers again in 3 or 7 swings in the future.

5 Wave Impulse Structure + ABC correction​

Source: https://elliottwave-forecast.com/vi...ish-structure-calling-upside-since-july-2023/
 

Elliottwave-Forecast

Master Trader
Feb 17, 2017
2,466
9
84
www.elliottwave-forecast.com
In this technical blog, we will look at the past performance of the 4-hour Elliott Wave Charts of GBPJPY. In which, the rally from 13 December 2023 low unfolded as an impulse sequence and called for an extension higher to take place. Therefore, we knew that the structure in GBPJPY should remain supported & extend higher. So, we advised members not to sell the pair & buy the dips in 3, 7, or 11 swings at the blue box areas. We will explain the structure & forecast below:

GBPJPY 4-Hour Elliott Wave Chart From 2.01.2024​

GBPJPY Perfect Reaction Higher From Blue Box Area

Here’s the 4-hour Elliott wave Chart from the 2/01/2024 update. In which, the rally to 188.93 high-ended wave (1) & made a pullback in wave (2). The internals of that pullback unfolded as Elliott wave double correction where wave W ended in 3 swings at 186.49 low. Then a bounce to 187.60 high-ended wave X & started the next leg lower in wave Y towards 185.18- 183.69 blue box area. From there, buyers were expected to appear looking for new highs ideally or for a 3-wave bounce minimum.

GBPJPY Latest 4-Hour Elliott Wave Chart From 2.26.2024​

GBPJPY Perfect Reaction Higher From Blue Box Area

This is the latest 4-hour Elliott wave Chart from the 2/26/2024 update. In which the pair is showing a strong reaction higher taking place, right after ending the double correction within the blue box area. Allowed members to create a risk-free position shortly after taking the long position at the blue box area. Since then the pair has already seen a break above 188.93 high confirming the next extension higher.

Source: https://elliottwave-forecast.com/forex/gbpjpy-perfect-reaction-higher-blue-box/
 

Elliottwave-Forecast

Master Trader
Feb 17, 2017
2,466
9
84
www.elliottwave-forecast.com
Vertex Pharmaceuticals Incorporated (VRTX), is a biotechnology company. It engages in developing & commercializing therapies for treating cystic fibrosis (CF). The company has collaborations with CRISPR Therapeutics AG, Moderna Inc, Entrada Therapeutics Inc, Arbor Biotechnologies Inc, Mammoth Biosciences Inc & Verve Therapeutics. It is based in Boston, US, comes under Healthcare sector & trades as “VRTX” ticker at Nasdaq. It is having 111.9 B$ market cap as on 26-Feb,2024.

VRTX trading at weekly highs as the part of impulse sequence within ((3)) of III & expect to remain supported in 3, 7 or 11 swings.

VRTX - Elliott Wave Latest Weekly View:

In weekly, it placed ((II)) at $176.36 low in October-2021 & favors upside in ((III)) as it broke above ((I)) high. It placed (II) at $233.01 low & II at $282.21 low. Above there, it ended ((1)) of III at $387.42 high & ((2)) at $341.90 low. Within ((1)), it placed (1) at $325.19 high, (2) at $283.60 low, (3) at $354.46 high, (4) at $320.01 low & finally (5) as diagonal at $387.42 high. It corrected in ((2)) as 0.382 Fibonacci retracement of ((1)) sequence.

VRTX - Elliott Wave Latest Daily View:

Above ((2)) low, it extended higher in (1) of ((3)) of III, which ended at $448.40 high. Later, it corrected lower in (2) as sharp pullback at $410.80 low as 0.382 Fibonacci retracement. Above there, it favors upside in (3) of ((3)), which confirms above (1) high of $448.40. Until then, it still may extend lower as double in (2), if breaks below $410.80 low before it should resume higher in (3). Currently, it favors upside in 1 of (3) & expect impulse sequence to confirm it in (3). We like to buy the pullback in 3, 7 or 11 swings at extreme areas, when reached.

Source: https://elliottwave-forecast.com/stock-market/vertex-pharmaceticals-remain-supported/