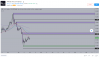
Here is my take on XRPUSD - as I know a lot of people hold or trade this coin. I done some analysis last week on this pair, and price hasn’t moved that much since, but here are the key levels I have marked up.
Overall, I am still bearish on Crypto (see my analysis on Bitcoin). I am not ruling out another big drop to the downside. Should this happen, Altcoins usually follow.
The level that stands out for me right now is the 0.20-21 region, and we may see some downside from here. In this area alone, we have a supply area, a round psychological number (0.20) and the 50 EMA on the Daily. A good number of confluences to send price down.
The second area that stands out to me is the 0.27749- 0.2850 area - another supply zone where price has fell previously. We may see a reaction at this level.
The final supply zone I have marked up is the 0.3362-0.34725 area. This is an area that we should pay close attention to, as this is where price has collapsed recently (15th February) - the highest XRPUSD has been since July 2019.
A key demand area to look out for is the 0.11336-0.12 area. This is where price fell to recently in the latest Crypto crash. Should we see some more downside to this area - this could be a key level to buy (or hold coins).
I have marked on the chart key psychological numbers that you should keep a close eye on (0.10, 0.20, 0.30). If you trade Crypto often, you may already know that traders react to key levels such as these - for example Bitcoin tends to react violently to the 10,000 level.
Hope this helps, let me know what you think below.