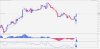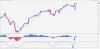

This is a simple and profitable trading strategy suited to newbies and advanced traders alike.
Linear Weighted Moving Averages and MACD track and identify trends and occurrences of convergence-divergence. Williams Percent Range monitors momentum, with crossovers occurring at key turning points in the price trend. Most important is the crystal clear signals for both entry and exit, and ease of interpretation. If you have been struggling with the psychological aspects of trading, simple and effective trade signals like this can help.
I will be posting further information and updates as entry / exit signals occur.
| Time Frame | H4 preferred, but you are free to test others. |
| Currency Pairs | AUDUSD, EURUSD, GBPUSD, USDCAD, USDCHF, and USDJPY preferred, but others can be added subject to suitability. |
| Technical Tools | 5LWMA : 5-Period Linear Weighted Moving Average on Median Price (HL/2) 15LWMA : 15-Period Linear Weighted Moving Average on Median Price (HL/2) MACD : 5, 10, 9 with Exponential MA on Close Price 15WPR : 15-Period WPR (Williams % Range) |
| Buy Entry / Exit | Open a buy position if: 5LWMA crosses above 15LWMA; MACD crosses above the zero line; and 15WPR crosses above the -50 level. Exit a buy position if: 5LWMA crosses below 15LWMA; or MACD crosses below the zero line; or 15WPR crosses below the -50 level. Whichever occurs first. |
| Sell Entry / Exit | Open a sell position if: 5LWMA crosses below 15LWMA; MACD crosses below the zero line; and 15WPR crosses below the -50 level. Exit a sell position if: 5LWMA crosses above 15LWMA; or MACD crosses above the zero line; or 15WPR crosses above the -50 level. Whichever occurs first. |
| Entry Signals |  |