Kaufman Volatility indicator is a VertexFX client-side indicator script that provides a measure of volatility and in identifying the current stage of the market.
This indicator was designed by Perry Kaufman and is used in combination with other indicators to estimate stop-loss and volatility characteristics of the market.
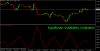
When the market is in a consolidation phase, the Kaufman Volatility indicator is dropping in value. On the contrary, when the market is trending strongly (either bullish or bearish) the Kaufman Volatility indicator is rising. It does not provide us with the direction of the trend, but only the strength of the trend.
To calculate the Kaufman Volatility, we first find the absolute difference in the Close of the current candle from the previous candle.
This absolute difference is then added over the recent PERIOD bars to derive the Kaufman Volatility indicator.
The Kaufman Volatility indicator does not provide BUY or SELL signals.
BUY - This indicator does not provide BUY or SELL signals.
Parameters:
1) PERIOD - The period over which the Kaufman Volatility indicator is calculated.
2) SHOW_HISTOGRAM - Specifies whether the indicator is displayed as a line or a histogram. If SHOW_HISTOGRAM is TRUE, then the indicator is displayed in histogram style. If FALSE, it is displayed as a line.
This indicator was designed by Perry Kaufman and is used in combination with other indicators to estimate stop-loss and volatility characteristics of the market.
When the market is in a consolidation phase, the Kaufman Volatility indicator is dropping in value. On the contrary, when the market is trending strongly (either bullish or bearish) the Kaufman Volatility indicator is rising. It does not provide us with the direction of the trend, but only the strength of the trend.
To calculate the Kaufman Volatility, we first find the absolute difference in the Close of the current candle from the previous candle.
This absolute difference is then added over the recent PERIOD bars to derive the Kaufman Volatility indicator.
The Kaufman Volatility indicator does not provide BUY or SELL signals.
BUY - This indicator does not provide BUY or SELL signals.
Parameters:
1) PERIOD - The period over which the Kaufman Volatility indicator is calculated.
2) SHOW_HISTOGRAM - Specifies whether the indicator is displayed as a line or a histogram. If SHOW_HISTOGRAM is TRUE, then the indicator is displayed in histogram style. If FALSE, it is displayed as a line.