ICT Seek & Destroy Profile Friday Indicator – MetaTrader 4
The ICT Seek & Destroy Profile Friday Indicator MT4 is a precision tool designed to detect potential high-volatility trading days—specifically based on the breakout of the Asian session range during the London session.Built for MetaTrader 4 (MT4), this indicator helps traders identify market days that may follow the Seek & Destroy (S&D) profile, a concept rooted in ICT (Inner Circle Trader) and Smart Money trading strategies.
Core Logic & Market Session Breakdown
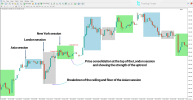
The indicator monitors whether the London session breaks both the high and low of the Asian session range. When this double breakout occurs, the indicator labels the chart with "Potential S&D Day".It also visually separates trading sessions for clarity:
· Asian Session → Blue Box
· London Session → Gray Box
· New York Session → Green Box
Indicator Specifications
Category | ICT, Smart Money, Market Session Tools |
Platform | MetaTrader 4 (MT4) |
Skill Level | Intermediate |
Indicator Type | Breakout, Reversal, Liquidity Event Detection |
Timeframe Compatibility | Multi-Timeframe |
Trading Style | Intraday |
Markets Supported | Forex, Crypto, Commodities, Stocks, Indices |
Download Link |
How the Indicator Works
After the London session confirms a breakout of both the high and low of the Asian session, the New York session is analyzed for confirmation of the S&D pattern. The indicator marks the day as “S&D Valid Day” under one or more of the following conditions:1. Price returns into the London range.
2. New York price action stays entirely within the London range.
3. New York session completely engulfs the London session range.
Example in Bullish Trend
· Instrument: XAU/USD (Gold), 30-minute chart· Pattern: London session breaks Asian session’s low first, then high.
· Result: Price stabilizes above the London high during the New York session.
· Outcome: Indicator confirms a strong bullish move, highlighting a potential buy zone.
Example in Bearish Trend
· Instrument: USD/JPY, 1-hour chart· Pattern: London session breaks Asian high first, then reverses sharply and breaks the Asian low.
· Result: Price remains below the London low throughout the New York session.
· Outcome: Indicator labels the day as a valid bearish S&D, indicating seller dominance.
⚙️ Features & Visual Enhancements
· Automatically highlights trading sessions in color-coded boxes· Real-time labeling of “Potential S&D Day” and “S&D Valid Day”
· Ideal for identifying liquidity grabs, reversals, and false breakouts
· Supports a variety of timeframes and trading instruments
✅ Conclusion
The ICT Seek & Destroy Profile Friday Indicator is an essential tool for traders focused on liquidity dynamics and session-based price behavior. By identifying days when both sides of the Asian range are taken out during the London session, it flags potential high-volatility scenarios in the New York session.This structured insight enables traders to adapt strategies based on smart money activity—ideal for those using ICT models, session strategies, or breakout reversals.


