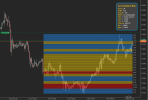
A new cTrader Accumulation Heatmap Indicator is now available and designed for traders who rely on clear structure and liquidity awareness. The indicator maps out where prices have clustered over time, highlighting potential support and resistance levels as well as zones where liquidity is likely to build.

This makes it easier to anticipate reaction points, validate breakout setups, and avoid entering positions directly into high-interest price areas. The heatmap displays cleanly on the chart and pairs well with trend indicators, volume analysis, and order flow tools.
If you want a simple visual way to understand where the market has shown repeated interest, this tool provides a strong edge without adding complexity.
Learn more and download from ClickAlgo: https://clickalgo.com/accumulation-heatmap

