
Correlation between several pairs - anyone ever tried?
- Thread starter Zahar
- Start date
- Watchers 4
You are using an out of date browser. It may not display this or other websites correctly.
You should upgrade or use an alternative browser.
You should upgrade or use an alternative browser.
It has been suggested and tried million times already. Such trading does not yield any advantage compared to trading single pairs.
A Forex trader should be aware of correlations for not expose oneself to an excess risk when opening several positions and limiting the risk by account percentage, but that is the thing correlations are good for in FX.
A Forex trader should be aware of correlations for not expose oneself to an excess risk when opening several positions and limiting the risk by account percentage, but that is the thing correlations are good for in FX.
Thank you for the reply.It has been suggested and tried million times already. Such trading does not yield any advantage compared to trading single pairs.
Speaking of million times, I only heard of two/maximum three pairs to be traded
together. What I mean is two/three/four...any number of pairs.
Perhaps there were attempts to trade a few pairs with different proportions?
If you know of something like this, could you advise me on where to look for it?
If you were opening multiple positions across the pairs then that most likely will only lead to over expososed risk. If you were trading one pair and looking for convergences'/divergences' from other correlating currencies. Most likely you would look for certain reliable patterns of converg/diverg and those would probably show up rarely and lead to very few trade opportunities. If you were using fundamentals it may be viable but this would be more of an investing approach not a trading approach. Just my 2c
Thank you for the reply.If you were opening multiple positions across the pairs then that most likely will only lead to over expososed risk. If you were trading one pair and looking for convergences'/divergences' from other correlating currencies. Most likely you would look for certain reliable patterns of converg/diverg and those would probably show up rarely and lead to very few trade opportunities. If you were using fundamentals it may be viable but this would be more of an investing approach not a trading approach. Just my 2c
I think the key words in what you are saying are "most likely". If I get you right, you yourself have never tried searching in this direction.
OK, if you allow me, I will take two terms out of your message and show you what I have found so far.
1....over exposed risk. - take, for example, EUR/USD - distance covered historically is 8,000 USD (if one pip = 1USD) we all keep this figure in mind when thinking of risk if we want to trade this pair, is it correct?
2....very few trade opportunities. - the question here is "what exactly is considered to be an opportunity?"
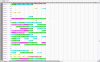
Now please see below the picture of a few pairs mixture where the pairs seen are just the last ones in a group:
G - is the same as with the EUR/USD example, i.e. 306USD, 267USD, 266USD, 351USD, etc.
H to Q - this year data with numbers in the colored boxes showing distance to historical lows in USD, for example, 89 in 593Q(5.04)blue means that if this grouping is placed as a trade, the distance to its historical low will
be 89USD, etc. Can it be taken as an opportunity?...
Or, in your opinion, does it make any sense at all?
Attachments
I have tried this method MANY years ago, I was using something close to this. http://www.earnforex.com/forum/f4/free-currency-strength-meter-12486/. The reason I used the term "most likely" through out my post is because you gave no defined information regarding entry/exit, day trade/swing trade/sit and hold etc. which leaves a
big grey area and I didn't want to interprit anything wrong. Just to clarify what I meant about the terms that you used from my message.
1. Over exposure- one see's that many USD pairs are bullish. One opens 1 trade on 4 USD pairs at 5% each. This would lead to 20% of the trading account being exposed to USD bearishness.
2. What I have found from my experience with this approach is that certian pairs converg/diverge but I had to wait for it to be just right in order to have relativley high odds of success. It had to be pure natural price movement. No news releases, wars, bail outs etc. even then profitibility was sparatic at best and 2 fairly good years were quickly wiped out by 4 bad years (edit) I did not trade this way for 4 years this was via back testing I traded this way on demo for about 1yr. I did have some moderate success with pinning the AUD/USD to gold and the USD/CAD to crude prices. But then again when I was trying this out in my early days nailing price on gold and crude was like shooting fish in a barrel.
Last edited:
Thank you for the link, just had a look at it, bul wll go back there later (have started hearing some very suspicious souds coming out of my comp lately, now they are getting more and more regular...)I have tried this method MANY years ago, I was using something close to this. http://www.earnforex.com/forum/f4/free-currency-strength-meter-12486/. The reason I used the term "most likely" through out my post is because you gave no defined information regarding entry/exit, day trade/swing trade/sit and hold etc. which leaves a
big grey area and I didn't want to interprit anything wrong. Just to clarify what I meant about the terms that you used from my message.
1. Over exposure- one see's that many USD pairs are bullish. One opens 1 trade on 4 USD pairs at 5% each. This would lead to 20% of the trading account being exposed to USD bearishness.
2. What I have found from my experience with this approach is that certian pairs converg/diverge but I had to wait for it to be just right in order to have relativley high odds of success. It had to be pure natural price movement. No news releases, wars, bail outs etc. even then profitibility was sparatic at best and 2 fairly good years were quickly wiped out by 4 bad years. I did have some moderate success with pinning the AUD/USD to gold and the USD/CAD to crude prices. But then again when I was trying this out in my early days nailing price on gold and crude was like shooting fish in a barrel.
With your experience, you seem to have found your warm nest in FX trading. But if you may feel like keeping company with me, I will only be glad to share what findings I have with you as well as learn from you.
Zahar, go for it! Just because this approach (or something similar) wasn't for me dosen't mean at all you can't find success with it. Open a journal on the forum, give it a HONEST foward test on demo. I'll follow it.
Give it a HONEST forward test on demo - great idea! Thank you so much.Zahar, go for it! Just because this approach (or something similar) wasn't for me dosen't mean at all you can't find success with it. Open a journal on the forum, give it a HONEST foward test on demo. I'll follow it.
Besides, it is going to be a real challenge for myself too. Frankly, I have no idea what a journal is and how I can open it, may I hope for your help with this part?
Also, I have some doubts about some things...
1. I have been looking for the traders using this method for rather a long time (spent a few hours today on Currency Strength Meter - no again, the idea is similar, but the method is very different), all in vain. So I do not know what to say if people ask me what it is like... I call it unusual (but don't like the word myself).
2. I think my method (use this word because I even doubt if I can call it a system) is the most simple thing one can imagine, but you told me about "a big grey area" (no defined information regarding entry/exit, day trade/swing trade/sit and hold etc.), which means I failed to explain the simple things...
For example, entry/exit - I do not know how they are calculated because entry in my method is when I think it is OK to enter, exit - when I think the profit is OK for me (usually it is 1%+ of a current balance simply because I think it is enough); day trade/swing - I may open and close a few trades within one day or I may have to wait a few days to close one trade, etc.
I think it is so simple because nothing scientific is used in my method (no
charts, no indicators, no equations - nothing but what we use in day-to-day
life)... perhaps, this is the very reason why it is so difficult to explain to modern generation people?
3. I think it only makes sense to start the whole thing if I can give certain guarantees to the traders, who may feel interested to join, and not to break
any of those on the way.
Honestly, I am not sure what the guarantees must be... for example, I never
use stop-order because I never feel a need for it, i.e. the draw down is always so small compared to the account balance that I am never worried or
nervous... Can my guarantee on this issue sound like "You will never feel
worried or nervous."?
I am sorry if it takes too much of your time, but I hope to know what your opinion is so far.
Zahar,
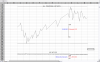
I'm not afraid to say I trade multiple pairs, since I'm a basket trader. Multiples have really expanded my accounts on a grand scale. The 6 JPY, minus GBPJPY, have a habit of syncing up and running. EUR is the same at times. It'll show itself on H4 TF. You can verify direction with 1W TF.
I started doing this via 6 windows and separate orders. Now, When I see the setup forming, I just open a 6-pr basket and watch the show. LOL There are times when I have a 14-pr basket running. So, no, there is no limit.
Here's an example of one of my full 7-pr JPY baskets:
Last edited:
Zahar,
I'm not afraid to say I trade multiple pairs, since I'm a basket trader. Multiples have really expanded my accounts on a grand scale. The 6 JPY, minus GBPJPY, have a habit of syncing up and running. EUR is the same at times. It'll show itself on H4 TF. You can verify direction with 1W TF.
I started doing this via 6 windows and separate orders. Now, When I see the setup forming, I just open a 6-pr basket and watch the show. LOL There are times when I have a 14-pr basket running. So, no, there is no limit.
Here's an example of one of my full 7-pr JPY baskets:
Hi ezrydn,
Thank you for the post!
Unfortunately, I am a full zero with charts...
What I have is statistics collected on 30 pairs since 1995. I learned to make
mixtures of any number and proportion of pairs. Some of the groupings I make
turn out to show a very narrow channel of historical up/down range, some even show just a couple of dollar distance to their historical lows. Those are
the ones I think are risk free and buy.
To understand better what I mean you can ask me to make a grouping of
any pairs of your choice (for example, the 6 ones in your basket, or whatever). I will make the mixture specially for you, and you will
see: historical high and low for this group; weekly rate changes since July 15,
2011 till today. I hope you will find it worth your time and attention...
Also, I hope to learn from you.
You can open a thread in the journals section of the forum and log your trades with info/pics/video.Give it a HONEST forward test on demo - great idea! Thank you so much.
Besides, it is going to be a real challenge for myself too. Frankly, I have no idea what a journal is and how I can open it, may I hope for your help with this part?
Also, I have some doubts about some things...
1. I have been looking for the traders using this method for rather a long time (spent a few hours today on Currency Strength Meter - no again, the idea is similar, but the method is very different), all in vain. So I do not know what to say if people ask me what it is like... I call it unusual (but don't like the word myself).
2. I think my method (use this word because I even doubt if I can call it a system) is the most simple thing one can imagine, but you told me about "a big grey area" (no defined information regarding entry/exit, day trade/swing trade/sit and hold etc.), which means I failed to explain the simple things...
For example, entry/exit - I do not know how they are calculated because entry in my method is when I think it is OK to enter, exit - when I think the profit is OK for me (usually it is 1%+ of a current balance simply because I think it is enough); day trade/swing - I may open and close a few trades within one day or I may have to wait a few days to close one trade, etc.
I think it is so simple because nothing scientific is used in my method (no
charts, no indicators, no equations - nothing but what we use in day-to-day
life)... perhaps, this is the very reason why it is so difficult to explain to modern generation people?
3. I think it only makes sense to start the whole thing if I can give certain guarantees to the traders, who may feel interested to join, and not to break
any of those on the way.
Honestly, I am not sure what the guarantees must be... for example, I never
use stop-order because I never feel a need for it, i.e. the draw down is always so small compared to the account balance that I am never worried or
nervous... Can my guarantee on this issue sound like "You will never feel
worried or nervous."?
I am sorry if it takes too much of your time, but I hope to know what your opinion is so far.
1. I think your thread title captures your trading methodology.
2. If you use no charts etc. how do you come to the determination it is OK to enter.
3. I perfer to have a stop-loss.
I can't say that I have a opinion either way. The info I have so far: use cross correlations between pair. Enter when you feel its OK, ( very vauge), use no stop-loss.
Pictures and videos are beyond me.You can open a thread in the journals section of the forum and log your trades with info/pics/video.
1. I think your thread title captures your trading methodology.
2. If you use no charts etc. how do you come to the determination it is OK to enter.
3. I perfer to have a stop-loss.
I can't say that I have a opinion either way. The info I have so far: use cross correlations between pair. Enter when you feel its OK, ( very vauge), use no stop-loss.
Look how I see it: I ask a few (3 to 5) traders, who may be interested, to open demo accounts (the issue of brokers to discuss here); I recommend them what trades to place (they put their questions-I answer them; it can be
a discussion); I hope it won't take long everybody in the demo round to start
seeing what I fail to explain with words. With better understanding, things will
be running much more smoothly.
1. OK
2. Could you please see the table I sent you earlier once again?
I think I will be more informative on it below:
a) I trade the proportion "account balance : contract size" as 1:2.
For example, if ab is 500USD, I only trade contracts 0.01 lot (1,000USD)
or 5,000 then 0.1 lot; or 50,000 then 1 lot.
b) to find and choose trades-to-be I use this table where:
the pairs seen are just the last ones in a group (this is a table for 3 pair groupings)
G - is the same as with the EUR/USD example, i.e. 306USD, 267USD, 66USD, 351USD, etc. shows the distance (in USD) between high and low this or that pair has covered moving up and down (range) since 1995.
(you can see that with one grouping the historical range is as narrow as 84, i.e. 100 times less compared to EUR/USD)
H to Q - this year data with numbers in the colored boxes showing distance to historical lows in USD, for example, 89 in 593Q(5.04) light blue means that if this grouping is placed as a trade, the distance to its historical low will be 89USD; or 6 in 627Q (5.04) pink means 6USD to its hl; those with the RRRRR show that it was a record hl for this grouping (rather many in this very period because GBP/USD was falling down those days).
ENTRY: to open a trade I go to the tables where I can see everything I need to know about the groupings: choose one grouping or whatever number of them I am going to trade (there are some other things (not seen in the tables) I use here (for example, I am always trying to trade groupings with profitable rollovers), but they are secondary...
The main thing I keep in mind is: my ab is 500USD and my trade is 6USD (if 627Q) to its hl with the range 110USD, i.e. in this very case my balance is
500USD and danger to it (risk) is 6USD (or possibly a couple of dollars more).
I am sure that if you devote 5 to 10 minutes to the table, you will clearly see how simple everything is.
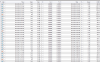
c) the table also shows how a grouping price changed from week to week.
3. You will see that with grouping trading:
a) there is no room for a stop-loss;
b) there is no need for it (compare 500/110/6).
Sending you three more files... please be attentive having a look at them.
I am sure they are going to be of help, too.
Attachments
Last edited:
Has anyone ever tried mixing a few currency pairs and use correlation between them for trading with profit?
Yep, dear Envid:
All JPY pairs tend to get positively correlated. EURNZD, EURAUD and EURCAD are positively correlated. GBPUSD and EURUSD tend to be positively correlated, while the EURUSD and the USDCHF tend to be negatively correlated.
Speaking only from the view of basket trades, all six JPY minus GBPJPY will run together. All EUR work well in a basket as do Gold, Silver, USDCAD and AUDUSD. Those are my main targeted baskets.
Zahar,
I see you put much, much more into trade prep than I do or would. I look at one indi to establish which group to attack, setup my basket and cut it loose. End of story. I like things simple.
Zahar,
I see you put much, much more into trade prep than I do or would. I look at one indi to establish which group to attack, setup my basket and cut it loose. End of story. I like things simple.
Similar threads
- Replies
- 0
- Views
- 2K
- Replies
- 3
- Views
- 964
- Replies
- 10
- Views
- 3K