Basics of Elliott Wave Theory
The Elliot Wave theory was devised by Ralph N. Elliott in 1938 in a book titled The Wave Principle and elaborated further in a 1946 book, Nature’s Laws: The Secret of the Universe. Robert Prechter and A.J. Frost popularized the Elliott Wave in their book Elliott Wave Principle: Key to Market Behavior in 1978. Prechter has written a total of 14 books on market behavior with an emphasis on Elliott Wave ideas.
Many prominent and successful market players, including hedge fund manager Paul Tudor Jones, embrace Elliott Wave concepts. Elliott Wave was quickly adopted in Forex and was being used as early as 1982. Today, you can find hundreds of books on Elliott Wave and many software packages that promise to identify the waves for you.
An equal number of prominent and successful market players view Elliott Wave ideas as unproven and the application of the ideas as deeply subjective. Top-drawer mathematician Benoit Mandelbrot, admittedly not a market player, doubts the predictive value of waves. Mandelbrot is the author of numerous articles and books on the fractal nature of financial prices. Other mathematicians point out that empirical data (almost always from equity prices, alas) does not validate any statistical inference.
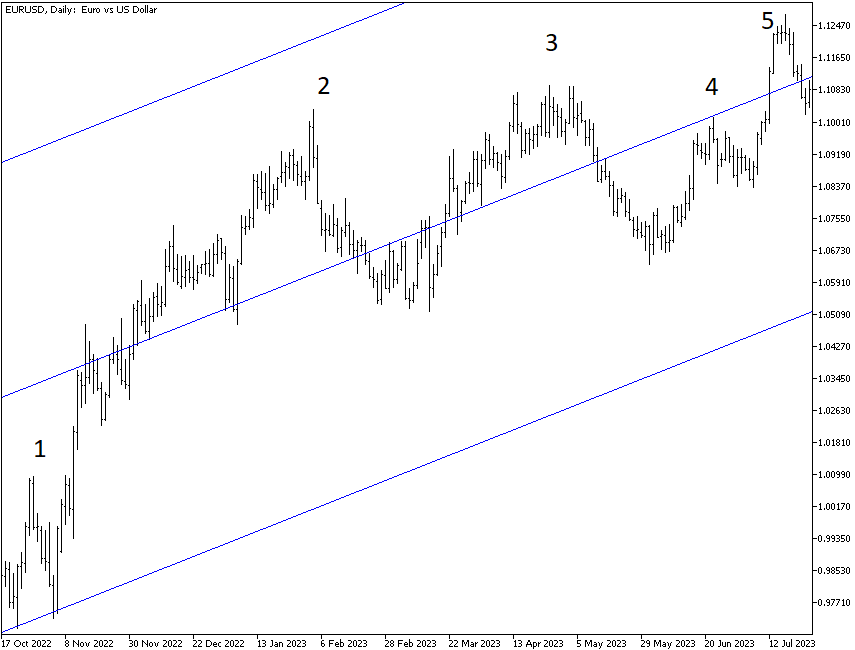
The best way to get a fistfight going among otherwise sane and reasonable people is to dismiss Elliott Wave ideas as silly. It is obvious from most charts of long enough duration that prices do indeed exhibit a wave-like pattern. One of the best ways to “see the waves” is to draw a linear regression channel along a daily price chart. See the next image, for example. This is a chart of daily prices in the EUR/USD from October 2022 to July 2023. Five upward thrusts are clearly visible, with accompanying corrections.
And yet, if you try to apply the Elliott Wave counts and other details of the theory, you will find that, in practice, market prices hardly ever deliver a clean count and a clear forecast. Elliott Wave proponents say there are always exceptions, or the timeframe is wrong, or some other excuse for the waves not behaving as the “theory” says they should.
This is why the Elliott Wave is not scientifically verified — in hard science, a hypothesis can be tested repeatedly, and everyone should be able to replicate the results; a hypothesis that is not proved after repeated efforts would be labeled “false” and discarded. Not so in this case. Despite the Elliot Wave never having been proven, a very high number of traders continue to have faith in it and to act on those beliefs. Beginning traders need to decide whether they want to spend the time and effort to learn the rules of a failed hypothesis. Common sense indicates you would not, and yet Elliott Wave and its key component, Fibonacci numbers, pervade the Forex market so much that we can sometimes correctly predict self-fulfilling prophecies, just like when a support line is broken. If a majority or near-majority of key market participants have religious faith in an outcome, they can force it to occur. Learning at least a few of the Elliott Wave basics is, therefore, a form of trading management self-defense.
The core concept is that market psychology moves first in an upwardly thrusting impulse or “motive” wave, followed by profit-taking or second thoughts, or some other reasoning that causes a corrective wave downward — but not to the starting point. There are three upward thrusts punctuated by two intermediate corrections, and after the highest high, the ultimate correction also goes in waves — three of them, two down and one up in the middle. The complete Elliott Wave sequence is a total of eight waves.
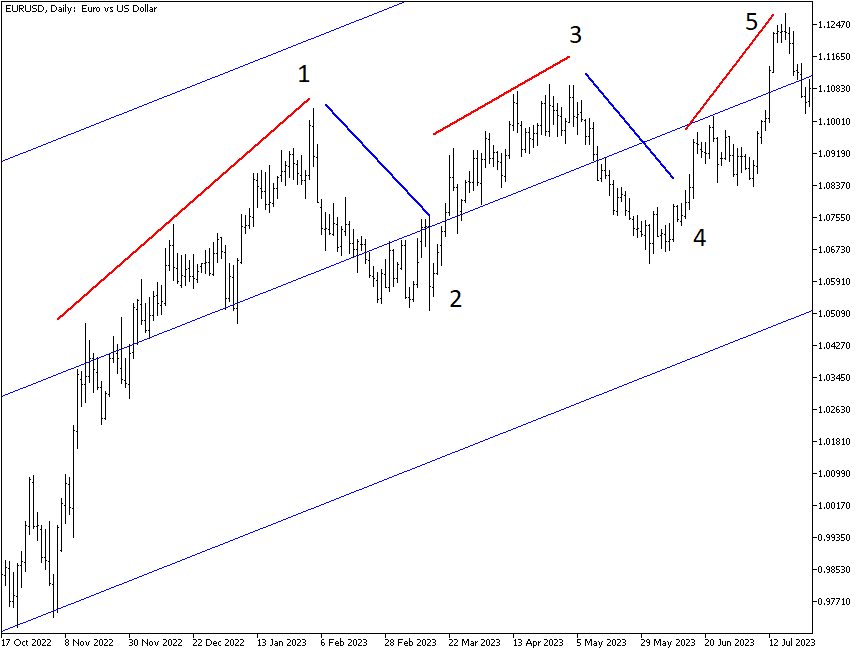
After the first impulse wave up, the next wave is corrective downward. After the corrective wave, a second burst of energy carries the price upward in a second impulse wave, again followed by a correction that does not go as far as the previous correction low. Then, a third upward wave ensues, and folklore has it that this third wave is the final and often the biggest of the waves. After the third up wave, almost anything can happen (including a fourth or fifth up wave) or a total collapse, but the Elliott Wave analyst exits as close to the top of the third up wave as possible. See the next chart. It shows that up waves are odd-numbered (1, 3, 5), and corrective waves are even-numbered (2, 4):
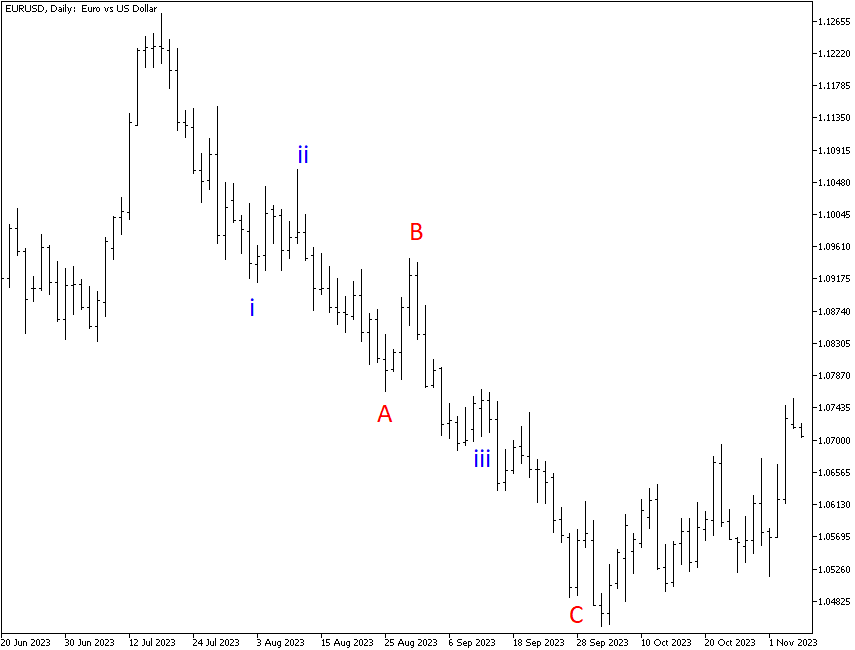
The “three upward waves” idea is well-established, although we observe in Forex that five upward waves are actually quite common. Far more complicated and difficult are the corrective waves. These have their own mini-wave structure and are assigned letters instead of numbers. The first down wave is a, followed by a mini correction of the correction back in the direction of the original upthrust, labeled b, and then a third down move, labeled c. To complicate matters, some analysts make the first set of letters upper-case and the second set in lowercase, and mini moves within the lettered move are labeled with Roman numerals. The final chart shows what happens after the events depicted on the previous one. This is the three-wave correction.
Critics will no doubt say these wave counts are incorrectly identified and labeled. This is a major problem with Elliott Wave theory — there is no single correct or definitive way to count waves. Even proponents admit you have to start over when your wave count comes out “wrong.” Once you see a chart prepared by an experienced Elliott Waver, the counts seem obvious, and everything falls into place. Doing it yourself is another matter.
A virtue of Elliott Waves is that the core idea — of thrust and corrections — is a good match for the way market participants behave. Early enthusiasm fades along with momentum, and the idea of profit-taking becomes logical, but when the rise resumes, bullish sentiment resumes, too. There is nothing magic about it, and it happens in every timeframe. It is not clear that Elliott himself understood the full fractal nature of markets since Mandelbrot’s path-breaking work had not yet been done when Elliott was working, but Elliott attributed what today we call a fractal nature to market behavior. One of the more troublesome aspects of Elliott Wave theory is that Elliott and later adherents believe Fibonacci numbers are the “secret of the universe.” This is to overstate their importance by a long shot, and yet we do sometimes see them at work.