Tick Volume in Forex
Quite often, Forex traders encounter indicators and expert advisors that apply tick volume to analyze or trade currency pairs. Tick volume that is present in every MetaTrader platform is based on the number of price updates (ticks) that come during the formation of a given bar or candle. At first glance, it seems to be a good approximation of real volume, but in reality, it is an imperfect substitute, which sometimes works poorly to simulate the actual volume for a given FX pair.
Why tick volume is bad?
First, the main idea of tick volume is flawed — one tick (price update) may be caused by either a small volume trade or a very large trade — it will not be accounted for in the tick volume, which will increase by one notch only. Moreover, big trades may happen within the broker's current price spread, which will not generate a tick.
Second, the main contributing factor to tick volume values is the broker's data feed. Forex brokers use different data feeds based on varying combinations of liquidity providers. This results in discrepancies between what tick volume shows at one or another broker; sometimes, these discrepancies are quite significant.
Why tick volume is good?
Given the lack of real volume information in the foreign exchange market, tick volume serves as the best estimate for this "real" volume that retail traders can find.
Despite the discrepancies in tick volume at different brokers, general trends in this volume usually hold between brokers. Moreover, there is even some correlation between tick volume and Forex futures volume.
Tick volume discrepancies
Here are some examples of EUR/USD tick volume discrepancies at two online brokers and for the EUR futures contracts (continuous).
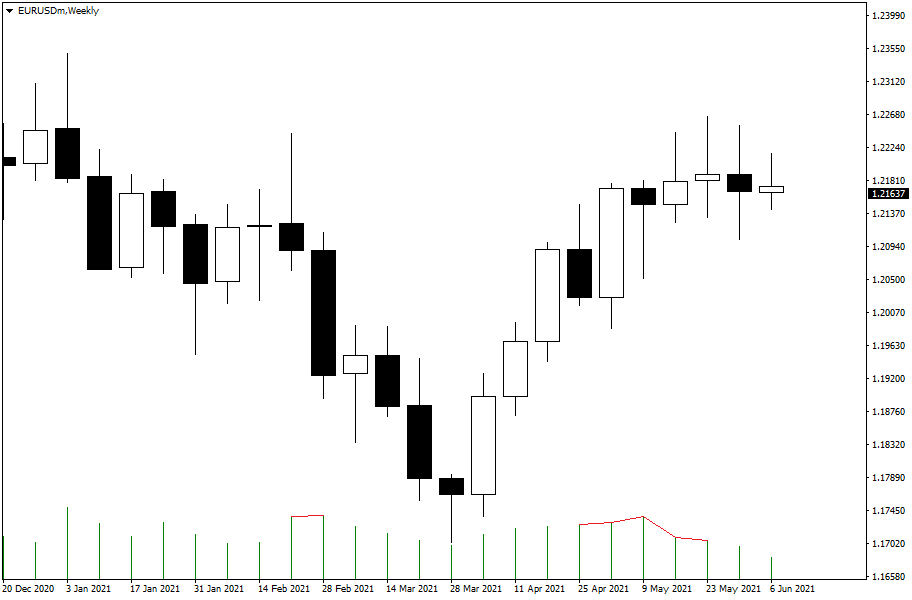
Exness tick volume from the EUR/USD weekly chart is presented below. Some volume levels are marked with red lines for clarity:
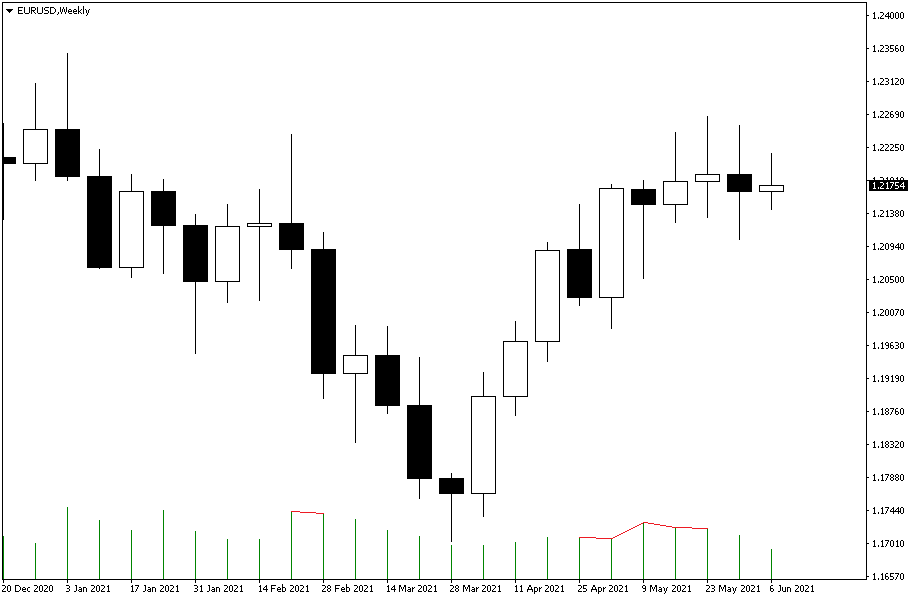
AGEA tick volume from the EUR/USD weekly chart for the same period with the same volume values marked with red lines:
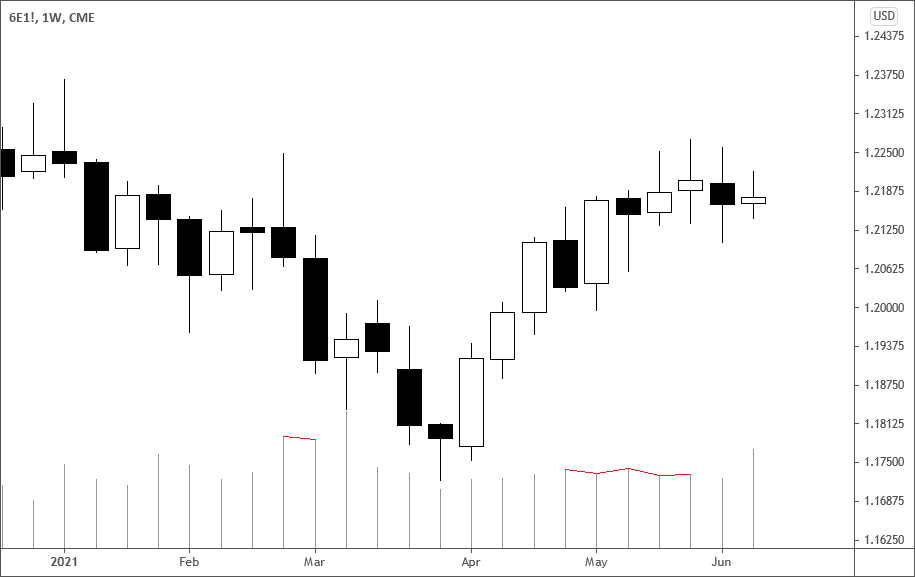
Tick volume seems to be mostly uncorrelated with real volume in the futures market. Of course, there couldn't be a perfect correlation between spot and futures markets, but there should be at least some correlation between the two. See the same weekly chart for the EUR futures (6E) provided by TradingView.
Conclusion
As you have noticed, tick volume changes sometimes do not hold even between two brokers. At the same time, a change in volume (the volume at bar N is higher than the volume at bar N−1 or vice versa) is crucial to operation of such popular indicators as Better Volume and Volume Suite.
Unfortunately, the high level of discrepancies between data feeds that form tick volume renders the tool unreliable in many applications that futures and stock traders would like to transfer from those markets to spot currency trading.
Even though the situation with tick volume improved greatly compared to several years ago, it might take some more time for the Forex tick volume to become truly consistent and meaningful as a data source for serious technical or sentiment analysis.
If you want to share your opinion on how real trading volume can be estimated in spot foreign exchange market, please visit our forum for a discussion.
If you want to get news of the most recent updates to our guides or anything else related to Forex trading, you can subscribe to our monthly newsletter.