The price of any asset traded in a financial market moves in cycles. The cycles tend to repeat themselves and form geometric patterns. Studies revealed that the legs, which form these unique geometric patterns, are related to each other through Fibonacci ratios. Each of these patterns is referred by a name, usually that of an animal, based on their appearance in a chart. Since these patterns develop naturally, they are referred to as harmonic patterns.
Harmonic patterns enable a trader to identify the price level at which the trend of an asset can probably undergo a reversal. Thus, it gives early entry advantage to a trader as long as the forecast turns out to be true. However, similar to any other trading system, harmonic pattern has its own share of disadvantages. This article discusses the most important drawbacks of harmonic pattern trading.
1. Too many patterns
The legs that make up the harmonic pattern share a particular Fibonacci ratio with each other. If there is only a single pattern, then a trader may be able to remember the ratios. On the contrary, there are at least half a dozen harmonic patterns (Bat, Butterfly, Crab, AB=CD, Gartley, etc.) Thus, it becomes difficult for a trader to study, remember, and identify those patterns without using specialized software or indicators. Additionally, the trader will find it difficult to spot the harmonic pattern that not only has a high probability of success but also offers admirable gains.
2. Contradicting signals
It is the most common problem faced by beginners. Harmonic patterns, which develop in different timeframes, may show conflicting signals. We may see a bullish and bearish pattern in two immediate timeframes. This may create confusion in the minds of a trader. The USD/JPY chart below shows a bearish total harmonic pattern in the 15 minute timeframe and bullish shark harmonic pattern in the 30 minute timeframe. In such circumstances only prior trading experience will enable a trader to assess the situation and take a proper trading decision. Mere knowledge of harmonic pattern will not be sufficient:
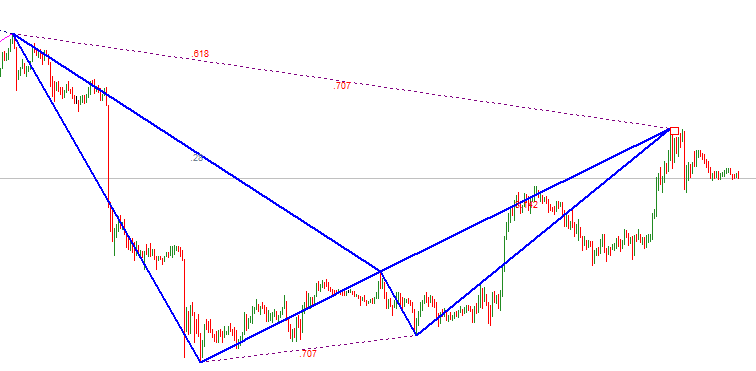
USD/JPY - Bearish Total harmonic pattern on M15 timeframe.
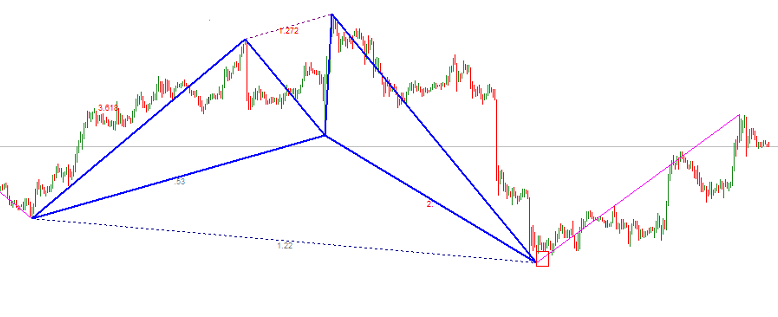
USD/JPY - Bullish Shark harmonic pattern on M30 timeframe.
3. Higher chances of hitting stop-loss
Traders who piously follow the rules of harmonic pattern trading would vouch for its precise entry and stop-loss levels. However, it can be understood that the entry and stop-loss rules are prone to easy manipulation by major players and can become a major drawback. In a Forex market, a few more pips deeper into the Potential Reversal Zone (PRZ) would be more than sufficient to trigger the stop-loss orders quite easily during volatile periods.
4. Predicting extensions
Even though harmonic patterns are generally perceived to have a fixed set of trading rules, it is not the case always. In several harmonic patterns, the legs that make up a pattern can have extensions. For example, in a simple alternative AB=CD pattern, the length of the leg CD can be either 1.27 or 1.618 times the length of the AB leg. In such circumstances, seasoned professionals calculate the probable length of the CD leg by studying the BC leg. It is needless to say that only experience can teach those techniques to a trader thereby liquidating the whole concept of making smart decisions simply by learning the harmonic patterns.
5. Timeframe
Harmonic patterns only deal with ratio between price swings. It does not speak anything about the timeframe to choose or the time needed to achieve or violate a particular pattern. Furthermore, harmonic patterns are mostly used by swing traders. The harmonic pattern trading is not suited for short-term timeframes and day trading in general.
6. Purely technical
Harmonic patterns are based on the assumption that human beings tend to repeat their past behavior even without their own awareness. If the fundamentals of an asset change in a drastic manner, then it is certain that the pattern will fail. A professional currency trader should certainly give importance to the fundamentals which strengthen or weaken a currency. When a large number of traders place a buy or sell order just because a pattern indicates a reversal at a particular point, then it becomes a self-fulfilling prophecy. A smart fund manager can easily take away their stops in no time. While there is no denial that short-term fluctuations cannot be explained always through economic data, still, placing a buy or sell order purely based on a harmonic pattern is certainly not a smart decision.
7. Pattern can morph into another
There is no guarantee that a harmonic pattern may complete as expected. One of the legs can extend thereby resulting in a failure of the pattern. Furthermore, the pattern can also morph into another pattern. Let us assume that a Gartley pattern is developing in the price chart. For a perfect Gartley pattern, the leg AB should be equal to the leg CD. However, the slope of the CD may not be equal to that of AB. Let the recent swing high be represented by X. Then, for a harmonic Gartley pattern, the point B and point D should not exceed X, while the point C should not exceed A. If the point D exceeds X, then the pattern becomes a failure. Additionally, the pattern can morph into a Butterfly harmonic pattern. Such a possibility will keep a beginner trader in dilemma.
8. Issues with Potential Reversal Zone (PRZ)
There PRZ of certain harmonic patterns is made up of a culmination of several Fibonacci ratios. The issue is that the levels indicated by the Fibonacci ratios may be spread over 50 pips or more. For example, the ratios that make up the PRZ in a Gartley pattern are 0.786 XA, 1.27 BC, and 1.618 BC. Furthermore, the level where AB=CD may also end up in the PRZ. Thus, it is not possible to place an order straight away and wait for the price to reach the PRZ. A retail trader has to constantly monitor for the formation of higher lows or lower highs to enter a long or short position. This makes the harmonic pattern based trading a complex process.
9. Clumsy charts
The price chart will have a clumsy look whenever a harmonic pattern indicator is attached to the chart. Seasoned traders always advise beginners to have a clean price chart so that support and resistance levels can be clearly seen. Having numerous lines on the price chart can divert a trader’s focus from important levels.
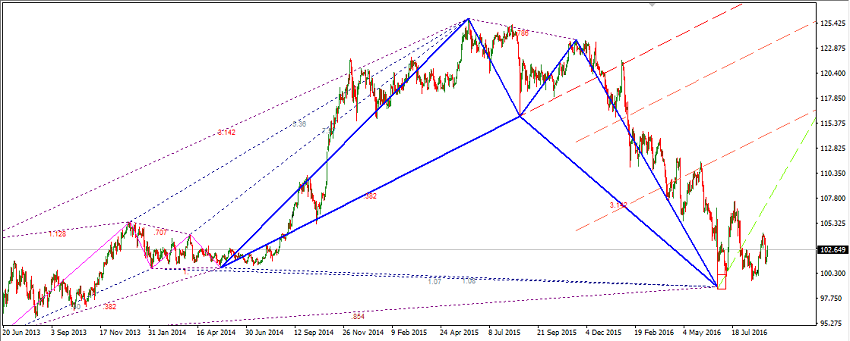
Too much chart noise due to harmonic pattern markup.
10. No dearth of new patterns
There is no dearth of claims of new harmonic patterns in the internet. Nearly all of them vary only in a minor manner from the six main harmonic patterns. In fact, such claims add to the complexity of trading the harmonic patterns further.
There is no doubt that harmonic patterns offer a degree of advantage to a trader. Still, practical experience and sticking to the rules, as proven by Turtle traders, is by far the most important to succeed in trading.