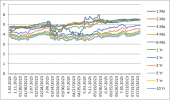
The yield curve is a graph that illustrates how the yield of an investment instrument changes over time in financial markets.
- Normal Yield Curve
- Inverted Yield Curve
- Flat Yield Curve
Our expectations in this theory suggest that long-term bond interest rates should be higher than short-term bond interest rates.

Source: https://home.treasury.gov/
Looking at the data between 03.01.2023 and 08.03.2023 on the Daily Treasury Par Yield Curve Rates for various years, it appears that there is little difference between short-term and long-term interest rates. The table reflects a flat yield curve, indicating similar yields across all maturities and pointing to an uncertain economic situation. This suggests that uncertainties and risks persist in the U.S. economy in 2023.

