Thanks to the attractiveness of online trading platforms and availability of sophisticated research tools for retail traders, day trading has become increasingly popular strategy. By definition, day trading is the act of buying (establishing a Call position) or selling (establishing a Put position) a financial instrument during a trading session to be closed that same session. In the case of binary options, that means picking an option with an expiration that is shorter than 1 day. However, not all trading strategies are compatible with day trading. When it comes to day trading, one of the most effective strategies is identifying reversals. Two easy ways to spot trend reversals are by drawing trend lines and analyzing candlesticks.
Spotting Reversals from Trend lines
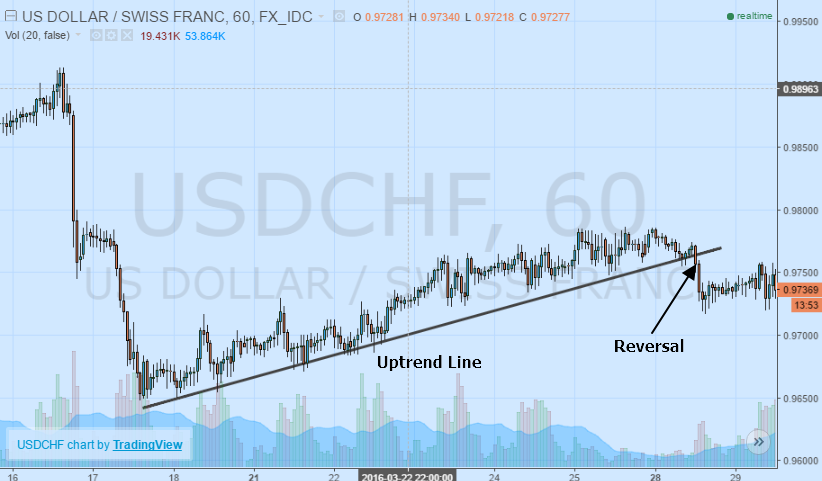
One of the most basic tools in technical analysis is drawing trend lines. Going by the classical motto of “the trend is your friend”, traders are encouraged to identify the trend over a defined period of time, drawing an uptrend line connecting the valleys of upward price momentum and drawing a downtrend line connecting the peaks of downward price momentum. Trend following strategies are one effective way to trade. Equally effective is trading reversals, especially useful if you happen to be a contrarian investor who likes to go against the grain.
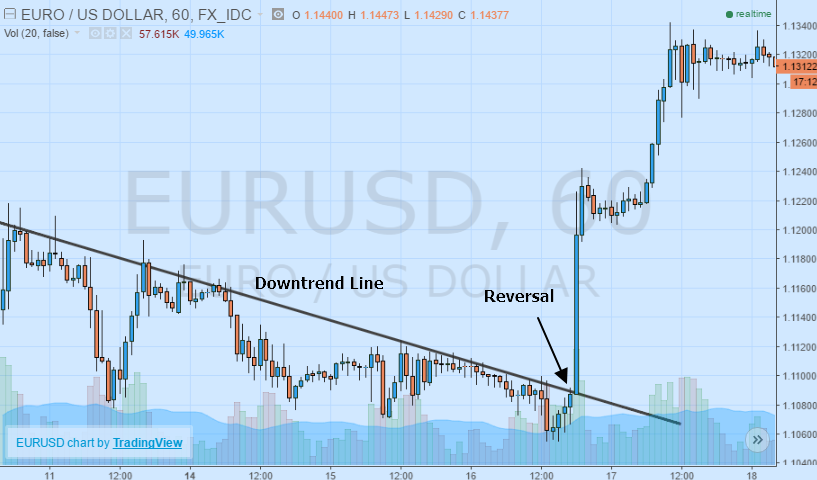
The key to identifying a reversal is by first establishing the trend line. Once a trend has been identified, the key is to then go ahead and wait for the trend line to be broken. If an uptrend line is broken to the downside and the candlestick for the time period closes below the trend line, this marks an ideal opportunity to go ahead and establish a Put position in anticipation of further downside. If a downtrend line is broken to the upside and confirmed by a candlestick close above the trend line, this would indicate a wise place to initiate a Call position expecting additional upside. Although the thought of waiting for candlestick confirmation can seem pointless, it is useful to prevent misidentification of a reversal.
Determining Candlestick Reversals
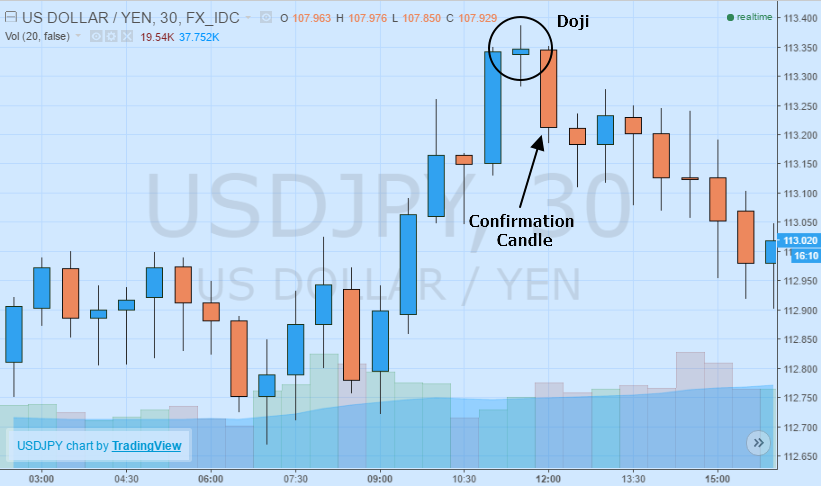
Candlestick reversals are slightly more complicated to identify and require a little more practice to identify than trend reversals because they visual patterns are different. While easy to identify a reversal with a trend line that has been broken, strictly relying upon candlesticks can be a little trickier. The first key to understanding candlestick strategies is to know what it measures. The candlestick has two main components: the body and wicks. The body measures the open price and closing price of an instrument during a period while the wicks define the highs and lows over the same time. In particular, we are going to explore Doji candlestick patterns which are an integral to identifying potential reversal setups.
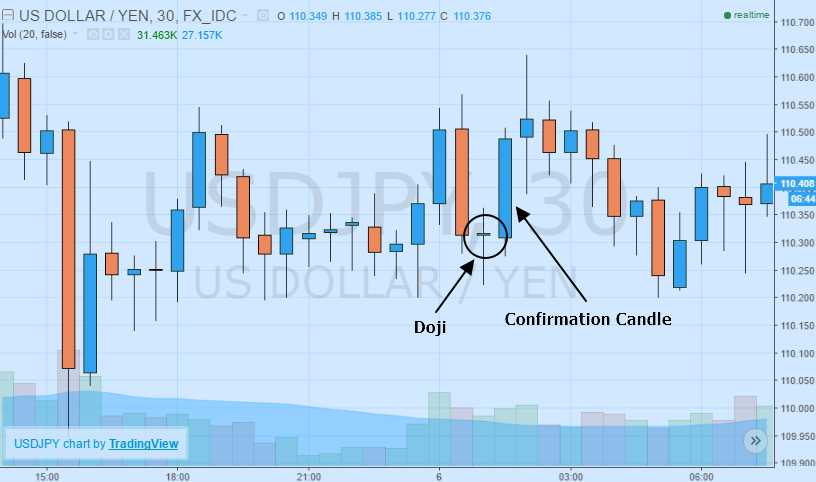
The most common type of Doji is a candlestick that looks like a plus (+) sign or a cross (t). This indicates that the open and closing price of the candle were almost equivalent, meaning the buying and selling pressure is nearly equal. After one of these patterns emerges, it is crucial to wait for at least one subsequent confirmation candle to verify a reversal. If it is a downward reversal, confirmation would come from a candlestick lower after the Doji emerges. Ideally, on the next candlestick lower a Put position would be established. If it is an upward reversal confirmation would be in the form of a candlestick close higher than the Doji. In this case, a Call position would be established after the confirmation candlestick closes higher.
Identifying trend reversals takes time and practice, but once the skill is honed, there are limitless potential opportunities for vigilant day traders.