Chart Patterns
When you hear the word “patterns,” you may immediately jump to the conclusion that this is old-fashioned, subjective “chart reading” and inferior to math-based indicators generated in seconds by a software program.
That would be a mistake. While it is true that it takes some time to learn chart patterns, patterns continue to be as relevant and useful today as when they were being devised over the course of the 20th century (and first definitively written about by Edwards and Magee in Technical Analysis of Stock Trends, published in 1948 and still in print). That is because patterns reflect the market psychology underlying price moves, and humans do not change their group psychology much, if at all, over the decades. Therefore, patterns repeat, and for much the same reasons, over time. It is amusing that someone who embraces candlesticks and candlestick configurations as holding meaning would turn around and reject classic patterns because they seem outdated.
The real reason to shy away from patterns is that there are so many of them, they can be hard to identify, and, like all indicators, they fail some of the time. It seems like a lot of work for a small return. Another reason is that candlesticks embody information in the very near term, like a period or two, while patterns tend to cover a lot more bars before they develop into something recognizable. Nevertheless, you should learn at least a few of the patterns, the ones that will help you identify when a reversal is pending. The primary use of pending reversal indicators is to set profit targets. It is your money — you should care about maximizing gains.
An Authentic Pattern “Secret”
The first pattern you need is Vic Sperandeo’s “1-2-3” pattern after a break of support or resistance, from Trader Vic: Methods of a Wall Street Master. It is obviously not a secret since Sperandeo’s book was published in 1993, but somehow traders tend to forget this one.
The traditional way of displaying a break of support is to show an inverted V, and a break of resistance, a V. However, that is for textbooks. In real-life trading, the price wobbles after the breakout, causing uncertainty. Sometimes, a break of support or resistance is false, and the price resumes the existing trend direction. How do you know when a breakout of support or resistance is authentic and should be traded?
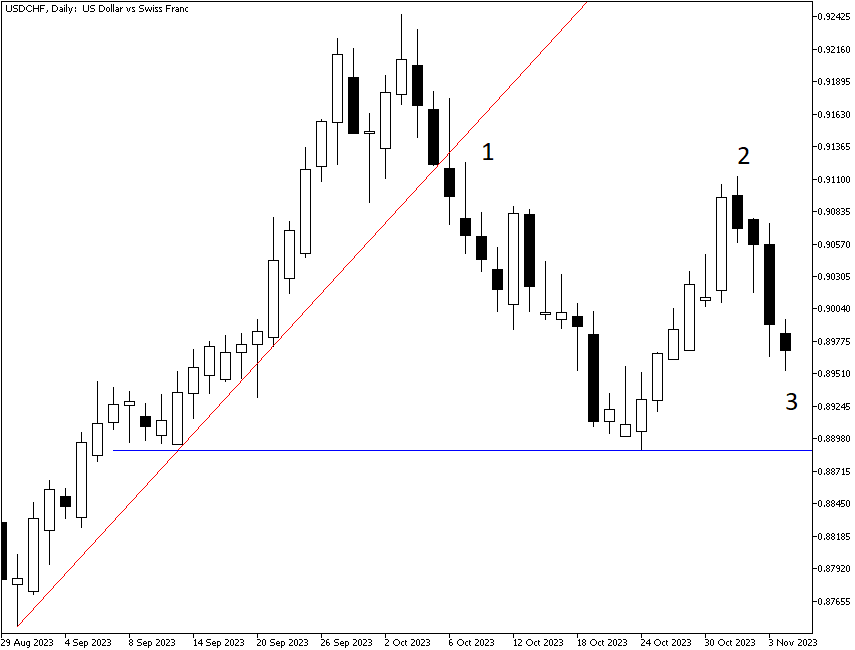
Here, you can see a daily chart of USD/CHF. Step 1 is the breakout of the support line. Step 2 is the test of the previous high — the intermediate move that causes so much anxiety and confusion, and something we see quite often in Forex. Failure to match and surpass the previous high is still only Step 2, however. Now, we need to see the price break the horizontal line drawn off the intermediate low in the earlier uptrend. This is Step 3. Only when this line is broken can we be certain that a reversal to a short position is the right action to take.
—
—
The more traditional classic patterns number over a hundred.
Triangles
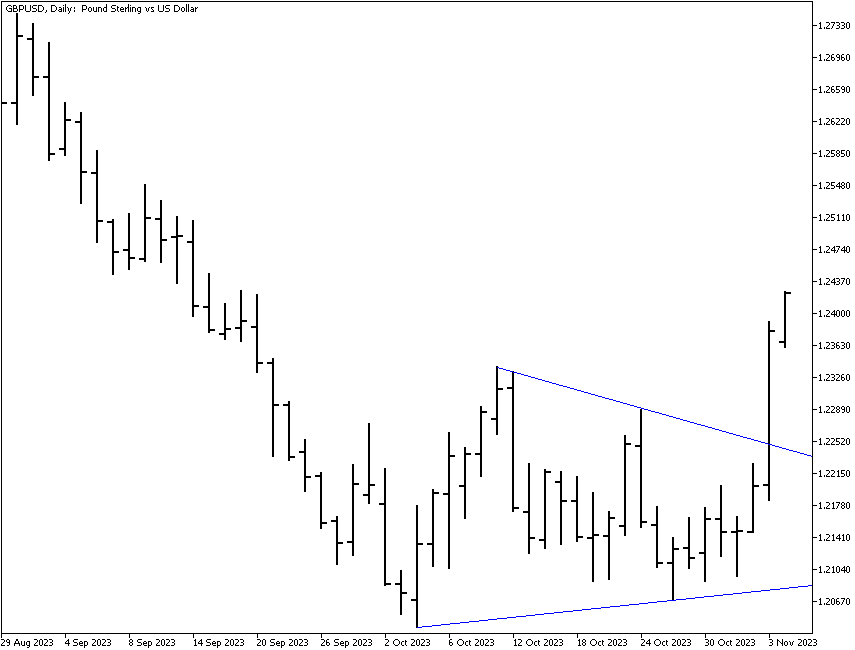
You will often see references in Forex commentaries to flags, wedges, and pennants, all forms of the triangle. Triangles are formed when you can easily draw both a support and resistance line and they can be extended to come together in an apex. It seems obvious that before the point is reached, the price should break out one way or the other. You can see a symmetrical triangle in the GBP/USD on the next chart. However, depending on how you draw the triangle, an argument can be made that here we can see a descending triangle. Often, the bottom support line is horizontal in an ascending triangle (an ascending triangle is the mirror image). That is the difficulty of using chart patterns - there are plenty of subjective interpretations when you are looking for patterns. Regardless, we got an upside breakout — which contradicts predictions from both the symmetrical triangle (a continuation) and the descending triangle (a bearish pattern). The pattern analysis failed to properly predict a price move this time.
Double Top and Double Bottom, Triple Top and Triple Bottom
The habit of traders to test and re-test old highs and lows is particularly pronounced in Forex, more so than in other securities. This leads to the formation of double tops and bottoms and also triple tops and bottoms. A double bottom looks like a W, and a triple bottom looks like a W on speed, with an extra leg.
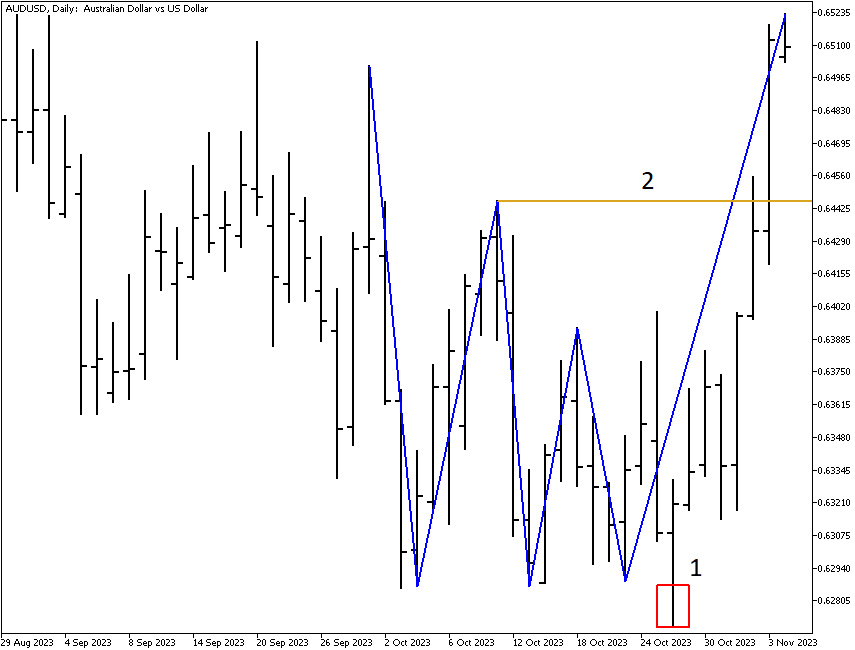
Please see the following chart. This is a daily chart of AUD/USD, which formed a triple bottom during October 2023. An argument can be made that the lowest low (1) should also be included, making a quadruple bottom. Regardless, once the prices surpass the level of the highest intermediate high (2), we can consider it a confirmation of an upside breakout. Be warned that prices often pull back to the confirmation level after the breakout. You have to be brave to sit the pullback out.
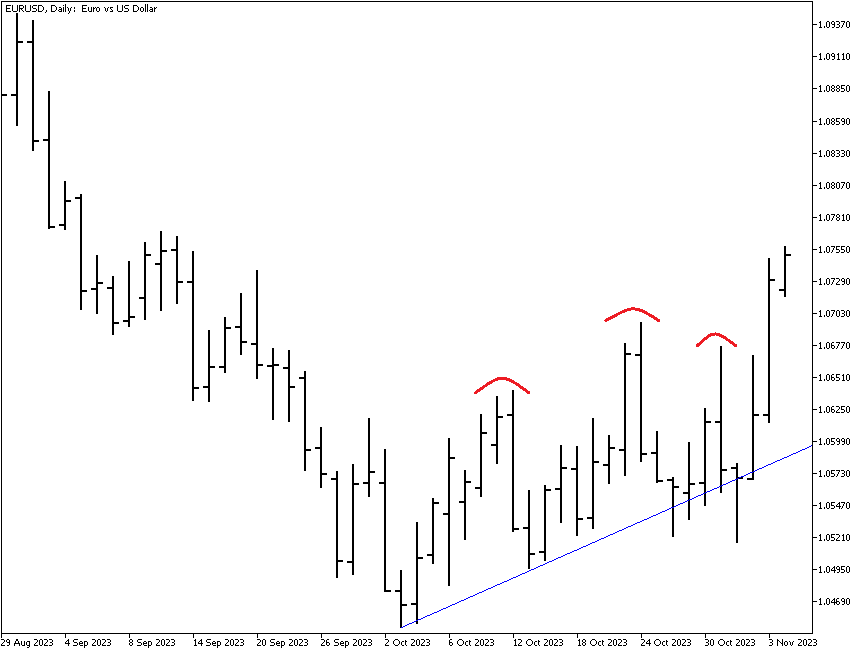
Head-and-Shoulders
The chart in the previous figure is not an inverted head-and-shoulders pattern because an authentic inverted head-and-shoulders has a center bump that is lower than the other two bumps or, in the case of regular head-and-shoulders, higher. See the next chart (EUR/USD). The head is always higher than the first shoulder, which is a test and a successful one of a previous high. However, the second shoulder marks the failure to match the intermediate high. The second shoulder does not match the first shoulder, either. But it could not become a confirmed sell signal until the neckline, the blue line connecting the two intermediate lows, is broken to the downside. Instead, prices jumped above the "head", which means that the pattern failed to predict the price movement.