Why Kijun Sen Is Superior to the Moving Average
The Ichimoku Kinko Hyo Forex indicator is made up of five lines. In this article, we focus on the Kijun Sen (red line), and how it compares against the more famous moving average (purple line).
Let’s begin with the formula, since Kijun Sen measures the past 26 periods, we compare it against the 26 period moving average:
- Kijun Sen = (Highest High + Lowest Low) / 2 for the past 26 periods
- 26 period moving average = Average of the past 26 closing prices
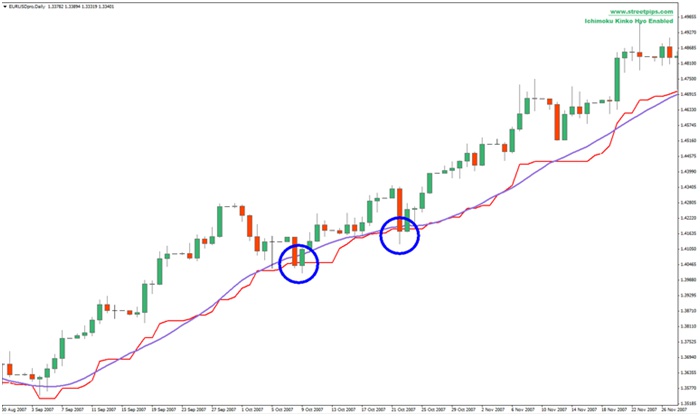
By taking the median of price extremes, Kijun Sen reflects the equilibrium, or 50% retracement of prices, taking volatility into account. A flat horizontal Kijun Sen means that price extremes have not changed, and the market is consolidating.
Prices tend to gravitate towards this equilibrium, as indicated by the blue circles in the above chart. Once a strong trend is identified, retracements toward the Kijun Sen serve as more conservative entry points. On the other hand, the 26 period moving average does not offer such insight since it does not take volatility and equilibrium into account — it usually is moving constantly and does not display any flat periods.
Because the Kijun Sen displays price equilibrium, it only changes when the “extremes” change, and does not change as much as a typical moving average. This quality allows the Kijun Sen to better track price movements and for this reason, traders commonly reference the Kijun Sen for stop loss placements as well. The Kijun Sen is part of the Ichimoku Indicator which you can find on MetaTrader 4.
By Glenn Ho
If you want to get news of the most recent updates to our guides or anything else related to Forex trading, you can subscribe to our monthly newsletter.