To be able to trade profitably, a Forex trader must develop a trading strategy through repeated testing to prove it works. We also have different personalities, and after trading the Forex market, we may come up with vastly different trading styles which are all profitable. When starting your trading career, it may be difficult to create a Forex trading strategy until you master the trade, and although it’s not always recommended, you can try to copy another successful trader’s strategy, at least for a while.
Of course, the most successful traders are also the very best in the industries and worked with investment banks and hedge funds, and a good example is Peter S. Kraus who worked at Goldman Sachs for 22 years. He came up with the DIBS trading method, which represents ‘Daily Inside Bar Setup’.
How the system works
This trading strategy is primarily suited for technical analysts, although it is not restricted to everyone else. The basic principle behind this system is to buy an asset on its ‘up’ day and sell it on its ‘down’ day; in this case, the asset would be a particular currency.
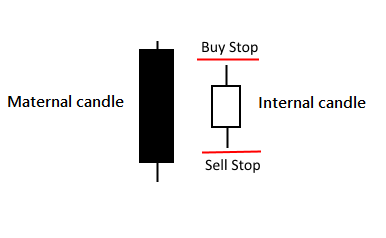
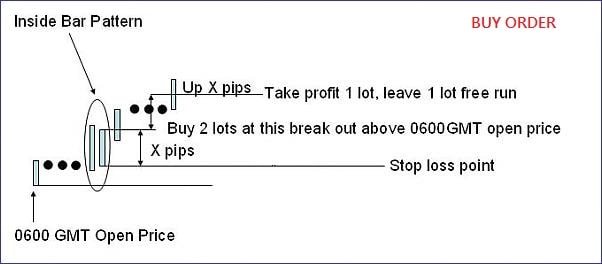
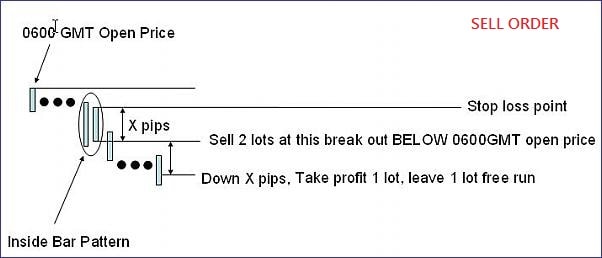
The question now arises, how do you know an ‘up’ or ‘down’ day? Simple, just check the day’s opening price at 6:00 GMT compared to the previous closing price. To do this, we first need to define the ‘inside candle’, and this is the pattern created by the candlesticks where the most recent candlestick is completely engulfed within the previous candlestick, like in the illustration below. This pattern is a characteristic of indecision in the markets, presenting an opportunity to either buy or sell when market sentiment turns bearish or bullish.
Once you have identified the beginning of the trading day at 6:00 GMT, switch to the H1 timeframe and look out for this pattern throughout the day. Since the pattern represents indecision, you will also need a supportive indicator to give you a hint of the market sentiment, and a good one can be the moving average. Add the simple moving average to your Forex charts, and this gives you a sense of the markets’ direction – if price is above the SMA, the market is bullish, and vice versa.
Now that you know the market sentiment, the same inside bar pattern will inform you on when to enter and exit the trade. Once the engulfed candle closes above or below the SMA, place the corresponding buy or sell order, and do not forget about risk management. In the case of a buy order, the stop-loss should be just below the engulfed candle body, and vice versa on a sell order. The take profit should account for at least a 1:1 profit ratio, or if you are bold enough, you can place a trailing stop to help you catch the entire trend.
Precautions to take
- Make sure the candle is completely engulfed by its predecessor – both the candle and stick, this is the only sure way of identifying indecision in the markets.
- The candles should be trading above or below the moving average, not within the SMA line. The SMA line is supposed to indicate sentiment, and the candlesticks trending within the line only represents more indecision.
- Make sure to check if there is any news that might affect the currency pair you are interested in. any critical news announcements can completely alter the trend and render the strategy meaningless.
Advantages of the DIBS method
Although Peter Kraus recommended using the DIBS method on the H1 timeframe, the same procedure can work on most other timeframes including the M15, M30, H4, and daily timeframes. However, when using this method on the higher timeframes like the daily and H4 timeframes, you might have to adjust the opening time from the day’s 6:00 (GMT) to the week’s opening on Monday at 6:00 (GMT). This makes the strategy very flexible and versatile to suit every kind of trader whether they are swing traders taking long-term positions or scalpers looking for a quick profit.
Besides being flexible, it is also quite accurate. There is no 100% profitable strategy, and anyone who tells you they have one is bluffing or trying to scam you. The DIBS strategy, however, is accurate most of the time because it catches breakouts in the market when the big players make trades while also creating huge profits from quick price changes.
There is also something great about this trading method, the pattern can be spotted soon after the trading day begins often within 6 to 9 hours. The 6:00 (GMT) trading time is right before the time when the London session begins, overlapping the Asian session and the US session later, and traders tend to maintain the trading trend throughout the trading day. You see, when trading, every trader wants to follow the crowd, and this action creates a longer and thus more profitable trend.
The verdict on DIBS
Finally, it is important to remember that the DIBS method is vulnerable to economic factors and the individual’s interpretation just like any other strategy. That is not to say that you should not use it, though, merely that you should first practice using it on a demo account before you actually place money on it. This would also give you the opportunity to figure out which timeframe and currency pairs works best for you so your trades are more thought out.
All-in-all, it has been proven by all traders who know about it to be very profitable; its ease of use is just a bonus. Most people still don’t know about it, and the strategy is still obscure, but the results speak for themselves. Besides, all platforms offered by top Forex brokers will allow you to make use of this strategy.
by Martin Moni