With many regulated Forex brokers offering cTrader as an alternative option to traditional MT4/MT5 platforms, a Forex trader might ask a reasonable question — is cTrader a good platform to use in trading?
A rare website has not posted their own version of a 'cTrader vs. MT4/MT5' article by now. Unfortunately, all such articles read the same — like an endless rewrite of one original story, which has been made obsolete by cTrader's and MetaTrader's rapid development. At EarnForex.com, we value your time, so we won't be reposting this kind of regurgitated factoid listicles. This guide will focus on the ways cTrader can help you to trade Forex better. It will also help you understand whether it is a good trading software for you at all. Ultimately, for experienced traders, it has never been a binary choice between two platforms — good traders know the value behind different tools and use them appropriately — in combination, separately, or by turns if necessary.
What you would really want to find out is whether cTrader is a worthy platform and how it can help you achieve your goals.
Visual
Visually, cTrader easily wins over any other stand-alone platform used to trade Forex — it opens to a very intuitive workspace with a chart, a list of instruments, and a detailed order/DoM menu. Control elements that aren't too important are rather small and don't get in the way of working with the main stuff — a chart, buy/sell buttons, orders.

If you rely heavily on the visual part of a platform when trading, cTrader is definitely going to be a comfortable platform to use. If you just want to check on the trades that you have entered in a
Also, when you actually start using cTrader and enjoying it beautifully built and functionally arranged interface, you will start noticing delays and slow reaction of the display items and control buttons. Unfortunately, this is a direct consequence of cTrader operating via .NET Framework, which also enables its cBots (equivalent of MetaTrader's expert advisors) to be coded in C# and compiled directly in Visual Studio (more on this later).
It is also easy to get overwhelmed by the amount of information cTrader is trying to present simultaneously on a single screen — it just shows too much of everything at a time. This is, of course, manageable with proper platform configuration.
Functional
To manual traders, cTrader offers a lot of features available
Trade placement
Executing a trade in cTrader can be done in multiple ways, including
First, while it opens with an attached small line chart, it can be easily disabled to make the
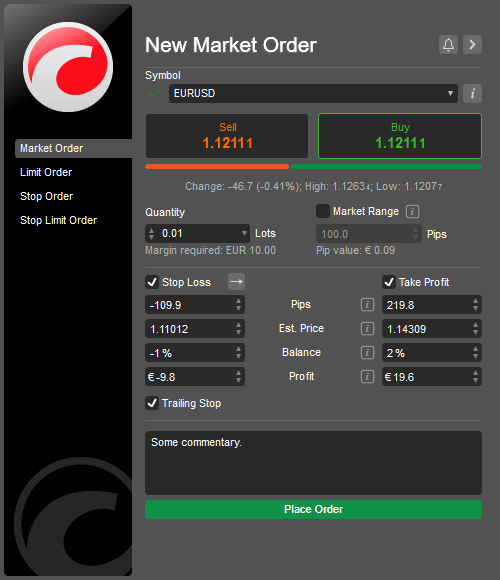
Second, it displays some really useful info about the trading instrument, like the daily change, pip value, and margin required. It also lets you view the detailed information about the symbol you are about to trade.
Third, and probably most important, you can set
Fourth, it lets you turn on the trailing stop (which is
Fifth, a unique tuning option is available for
And that's not mentioning the usual stuff like order size, maximum deviation, and order commentary.
Limit, stop, and
Manual trading goodies don't end on the order placement dialog. You can reverse,
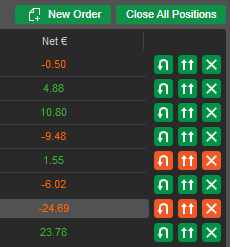
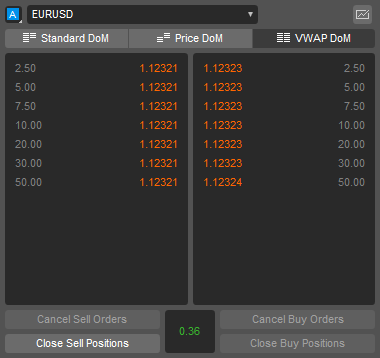
If closing all trades would be an overkill for your trading style, you can use cTrader's buttons to close all sell or all buy trades or to cancel all sell or all buy orders by symbol. This can be done in the DoM tab of the Active Symbol Panel or in the DoM view of a symbol in the Watchlist:
Additionally, cTrader lets you manage Advanced Protection for any position. This includes multiple
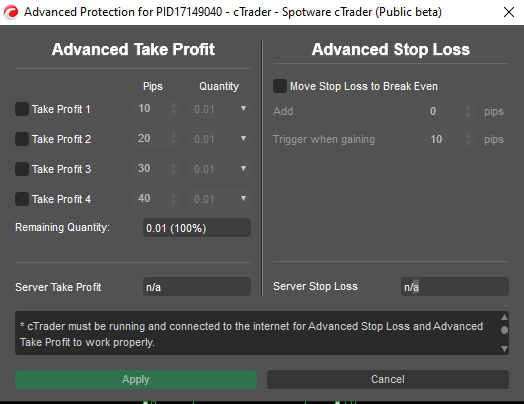
As you see, the
Symbol information
There are three main ways to view the detailed information about a currency pair or some other trading instrument in cTrader:
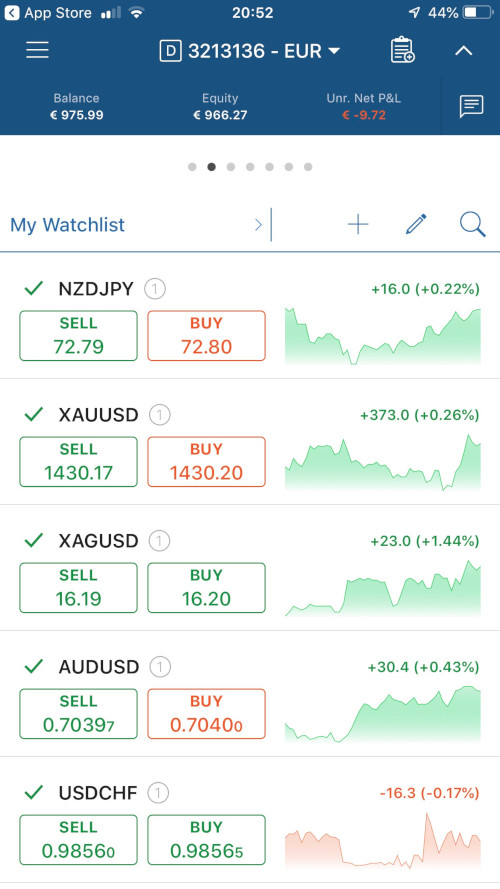
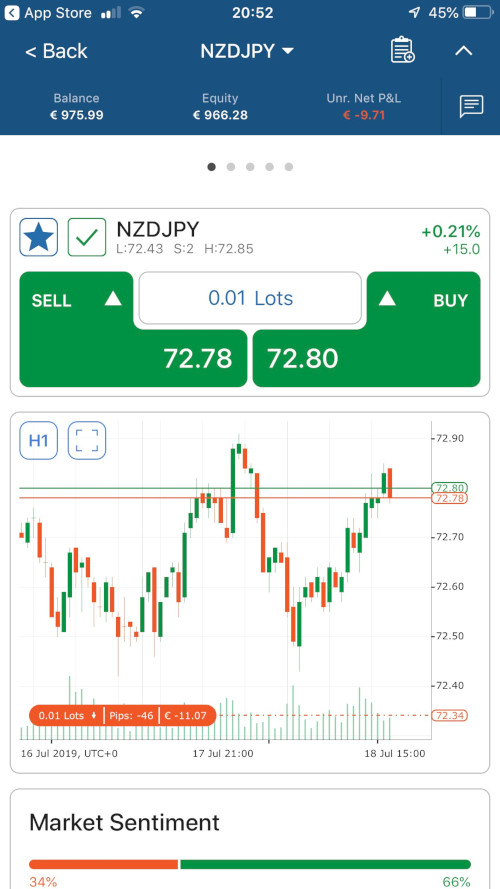
- Clicking the symbol name in the Watchlist will show its description, expand its quick trading buttons, and display the Market Sentiment scale (more on this below). Another click would expand the panel further by adding a Depth of Market (DoM) view and a set of buttons to control all trades and orders for the symbol at once. The DoM view can be either Standard, Price, or
Volume-Weighted Average Price (VWAP).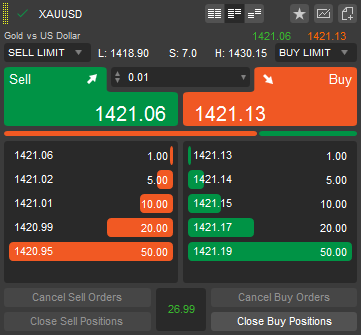
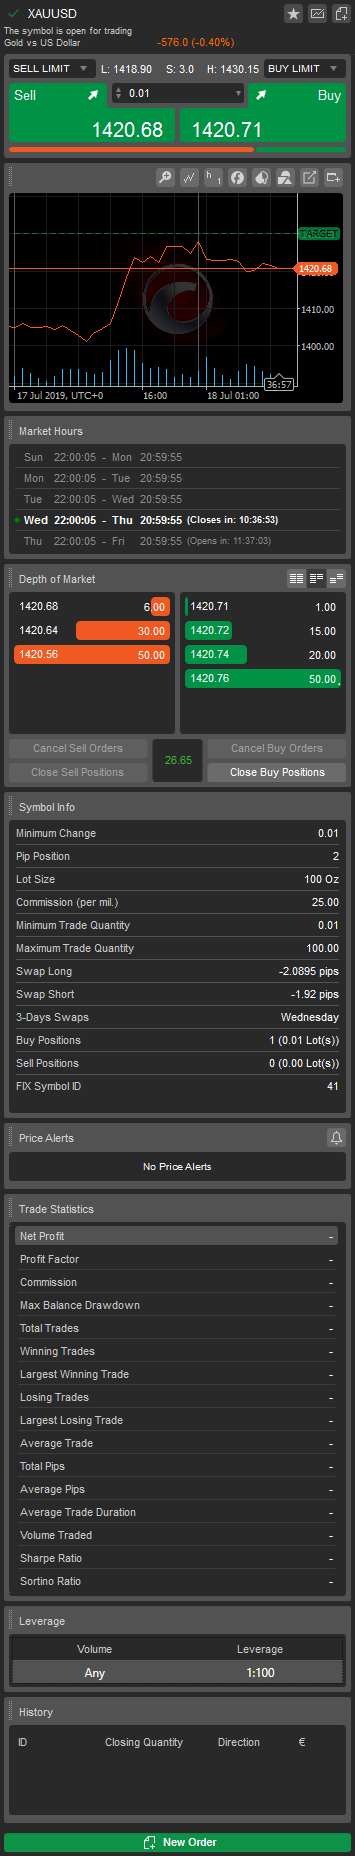
Right-clicking the symbol name in the Watchlist and selecting Symbol Window will open a separate window with symbol's description, quick trading buttons, amini-chart , its market hours, DoM, detailed symbol information (parameters like lot size, swap sizes, etc.), list of price alerts, trade statistics, leverage, and trading history.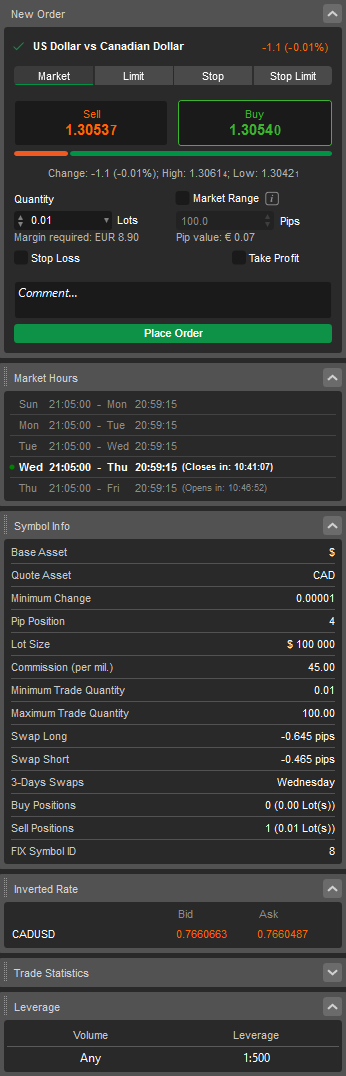
- The Active Symbol Panel, if enabled in the Layout menu, displays a quick order placement panel, symbol's market hours, detailed symbol information, inverted rate (e.g., USD/EUR for EUR/USD), trade statistics, and leverage.
All three, although very similar, are useful for different purposes and, depending on your trading style, you might need only one or two of them. It is a really
Sentiment analysis
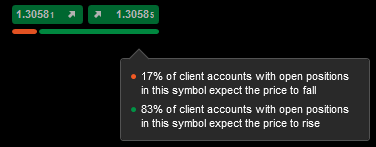
One of the biggest advantages cTrader offers to a trader is the global sentiment indicator for almost every symbol available for trading. If you use sentiment analysis in trading, this cTrader's feature is a goldmine. You can use it as a confirmation signal for your trades or you can use it to trade against the crowd, or you can monitor changes in the sentiment as signals in their own right. The sentiment indicator can be viewed in the Watchlist, on the chart, or in the Active Symbol Panel. A mouseover will reveal the exact percentage of the traders holding buy and sell trades for the symbol:
Server-side trailing stop
Trailing
Tick charts
With the popularity of tick charts growing among retail traders, cTrader now supports a range of tick timeframes. You can switch to a basic 1-tick chart or select any of the tick timeframes that combines N ticks in one candle (for example, 10 ticks):
Renko charts
In additional to traditional types of chart — bars, candles, and lines, cTrader offers some exotic chart types. One of them is Renko, which is quite similar to
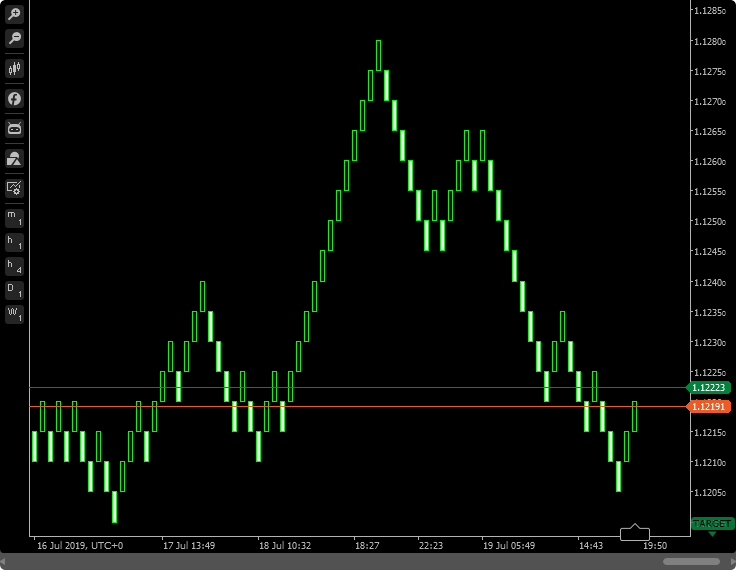
The
Range charts
Another exotic chart type available in cTrader are Range charts. They are somewhat similar to Renko charts, with the exception that candles may contain an upper or lower wick. Each candle consists of a chosen fixed amount of pips and either starts or ends at its high or low.
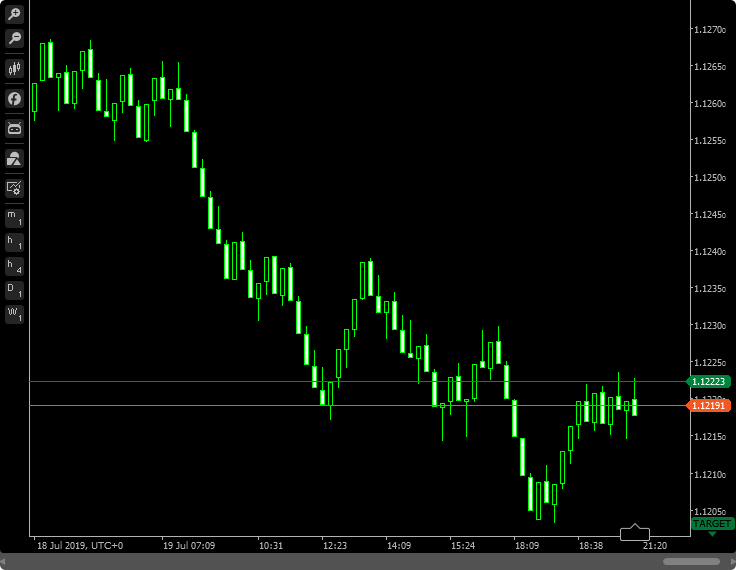
Range charts are another type of "timeless" charts that are helpful in choppy markets where normal candlestick charts wouldn't produce meaningful picture.
Dots charts
The third untraditional chart style available in cTrader is the dot style. It maps out bid and ask prices nicely for tick charts and shows close levels with dots for higher timeframes (essentially, like a line chart but without lines):
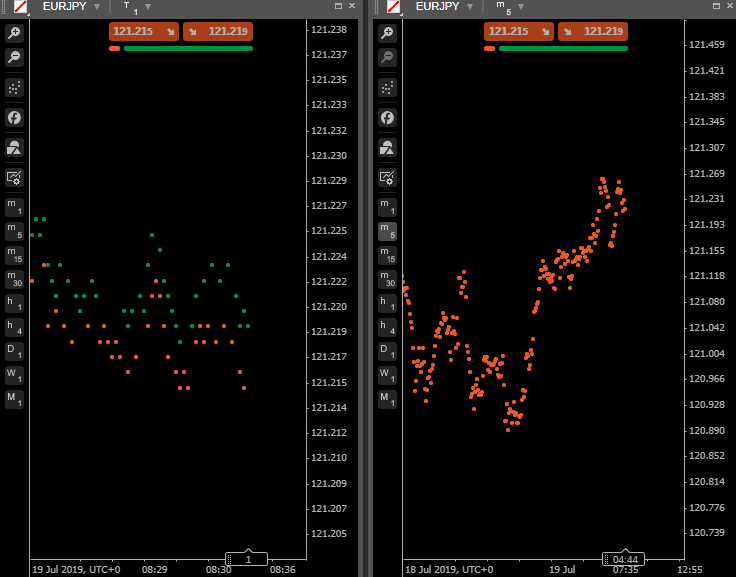
Chart objects
Chart objects are very easy to place on chart and manipulate. There are also quite a few of them available. However, a big detriment here is that you cannot set exact price/time levels for those objects via their properties window.
Quick timeframe switching
Timeframes can be marked as favorite. These favorites will be shown next to a chart. When the chart is active, you can use the arrow keys up and down to switch between your favorite timeframes. Keep in mind that doing so very quickly many times may cause the trading server to block you out temporarily due to request flooding. So, you have to be careful with this otherwise awesome feature.
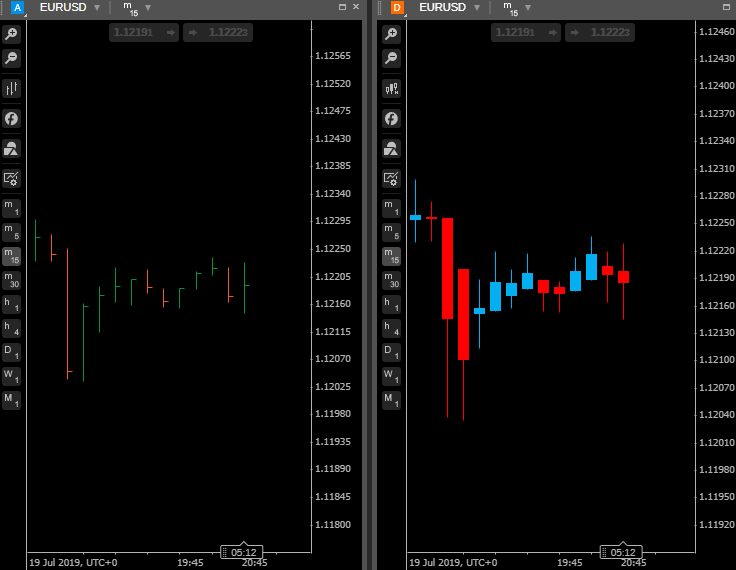
Quick currency pair switching
Fast switching is also available for currency pairs, albeit not with a hotkey. You can link several charts by assigning the same group icon/letter to them. Then, you can
Of course, with this feature you should be careful not to flood the server with too many requests too fast, otherwise it might block you out for a few seconds from the data connection.
Autochartist
cTrader offers Autochartist signals as a service for its users. It is a nice feature but it works poorly in the desktop version of cTrader. It lets you browse through three main categories: chart patterns, Fibonacci patterns, and key levels. Chart patterns include channels, triangles, wedges, and so on. Fibonacci patterns include harmonic patterns like Gartley, ABCD, Butterfly, etc. Key levels are support and resistance lines.
The list of detected patterns contains a date and time, symbol, type of symbol, direction, timeframe, pattern, length in bars, and quality:
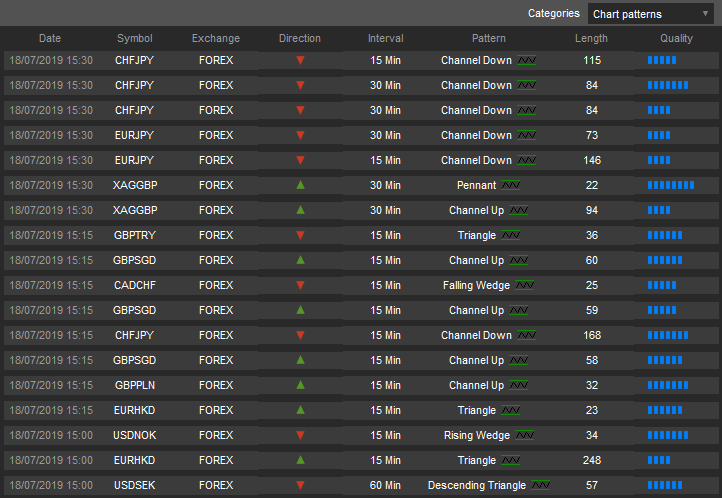
Unfortunately, these signals are not very useful:
- You cannot sort or filter them — only the last 50 signals are shown and that's all.
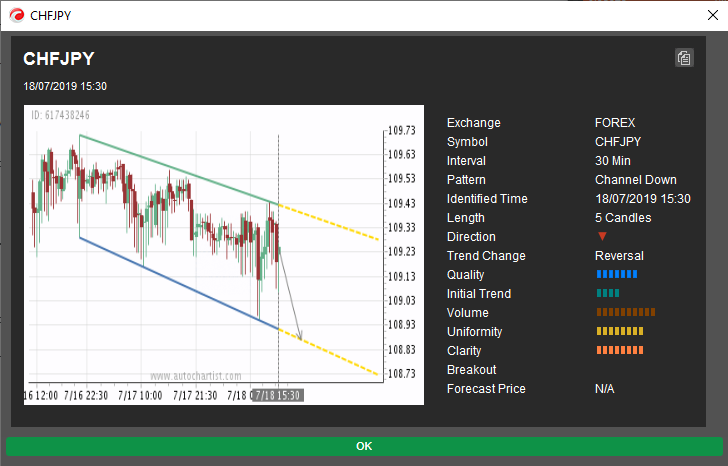
- The details show only a
non-interactive image chart, which cannot be used for further analysis. - Support and resistance levels haven't updated since December 2018.
Cloud storage
In cTrader, your Watchlist and Workspaces (sets of charts and layouts) are saved into a cloud storage. This allows you to access both Watchlists and Workspaces from other devices connected to the same cTrader ID. For example, on your PC, you can create a custom Watchlist with the symbols you prefer to monitor and then open the same Watchlist on your phone. Or you could load your platform's complete layout on another PC without copying any files manually. This is a significant improvement compared to other desktop platforms.
Mobile trading
Spotware offers a special mobile version of cTrader platform that lets you to analyze charts and trade from your phone. The charts and trading interface are clean and practical, but as is the case with other mobile trading platforms, doing serious chart research is very difficult on your phone. Running custom indicators and cBots is impossible in mobile cTrader.
Web trading
The

However, there are some differences:
- The major one, which you notice right away, is even poorer responsiveness and slower interaction, but this should be expected from a
browser-based trading platform. - There are no custom indicators or cBots in the web version.
- Economic calendar from FXStreet is another nice feature in cTrader Web. (If you want to learn more about economic calendars you can read our dedicated review post.)
- cTrader Web doesn't support Renko and Range charts.
- On the bright side, the web version offers an HLC bars style chart (bars without open price mark) and native Heikin Ashi charts, which currently are absent from the standard offer of the desktop platform:
As you can see, for a trader who does not require custom indicators or expert advisors, cTrader Web can be a totally adequate choice as the main trading platform. It lets you perform 99% of all tasks related to analysis and trading in the same comfortable way as the desktop version of the platform.
It should be noted that the web version is under constant development, and it is likely that we will see both versions (desktop and web) converge in their functionality at some point in the near future.
Automate
The Automate menu button switches cTrader into a development and testing mode. This is the place to create, modify, test, and optimize your custom indicators and expert advisors (cBots). It is also the place to apply cBots to a chart.
Development
cTrader scripts (indicators and cBots) are written in C#. The IDE provided in the platform is good but not great — it is enough to code a simple script if you are already good at C# and if you use online reference a lot, but creating something big and complex there would be a nightmare. Fortunately, cTrader lets you code everything in Microsoft Visual Studio and then use the code (or even compiled binaries) in the platform.
The
In theory, some MT4 indicators and expert advisors can be converted to cTrader format using services like http://mq4tocalgo.apphb.com/, but they work rather poorly — I had little success in converting my own indicators there. Even when the .mq4&rarrow;.algo conversion process yielded some results, there was a lot to fix manually, which required knowledge of both cAlgo and MQL4 coding languages.
FIX API
Since August 2016, cTrader supports FIX protocol API for communicating with cTrader trading server. FIX is an
Running
Running an expert advisor (cBot) in cTrader is somewhat different from what it is like in MetaTrader and other platforms in that it is done via a separate mode of the platform. You don't see manual trading charts while there and you don't see the cBots running while you are trading manually. However, the cBots will keep running even if you switch out from the Automate mode to something else. Such system looks somewhat inconvenient to many traders, but it might work exceptionally well for traders who either trade only in manual mode and to those who trade only with cBots.
Backtesting
In terms of backtesting, the platform offers normal and visual backtests for cBots but no backtesting for indicators. The backtesting process can be thoroughly controlled with date range, starting capital, commission, spread, and so on. The visualization is good and informative but lacks the past deals mapped on the chart — they appear only after the backtest is over. The trading report is informative but the number of statistical metrics and other diagrams is unimpressive:
The list of trades and orders can be saved to an XLSX file, which would let you analyze it further on your own, but that's it.
Optimization
Optimization setup is simple and, at the same time, offers multiple options to those traders/developers who are interested in a more advanced approach. Apart from the usual backtesting options and optimization ranges for the input parameters, you can set
Optimization reports consist of all the usual parameters such as net profit, number of trades, drawdowns, volatility ratios, and the overall fitness score. Detailed trade statistics is available for each optimization pass. You can also view the equity charts, trade history, and log for the top 20 optimization results.
The optimization process itself is quite fast. Elapsed time and estimated remaining time are provided for user's convenience.
Copy trading
cTrader supports access to copy trading or social trading facility called cTrader Copy. It allows registering either as a Strategy Provider or as an Investor. It is based off of the

Searching for strategies to follow is quite convenient. You can search by strategy name, filter by account types, ROI size, age, fees, number of copiers, and sort by ROI, copiers, and capital.
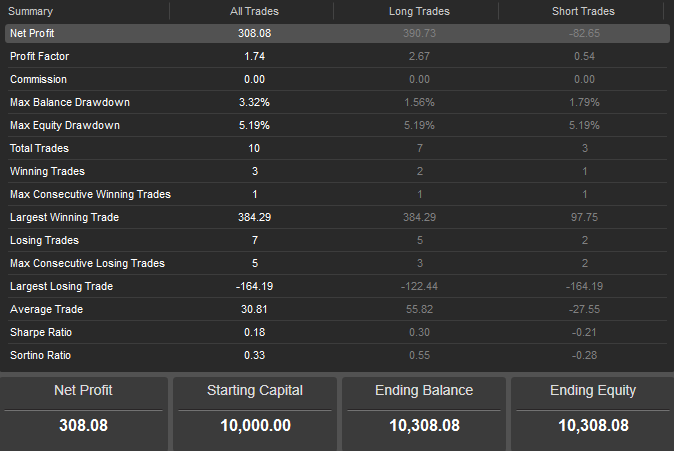
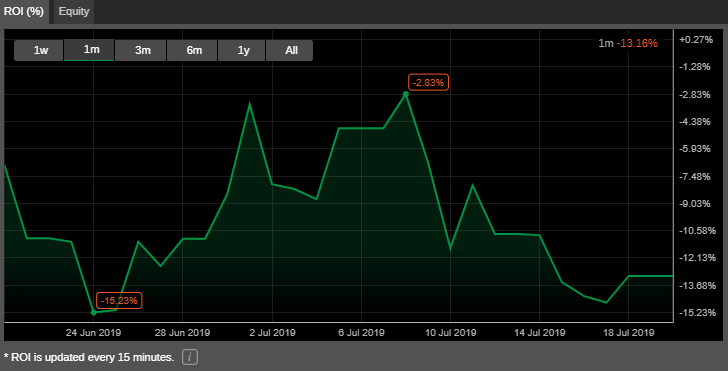
Detailed view of a specific strategy reveals tons of details, including ROI for the current month:
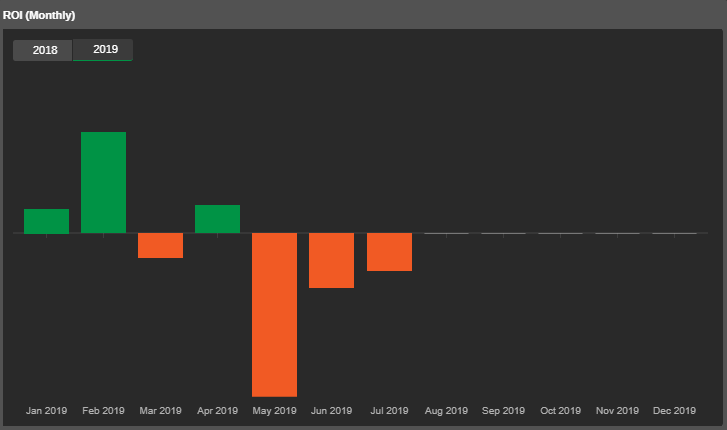
Monthly ROI for the year:
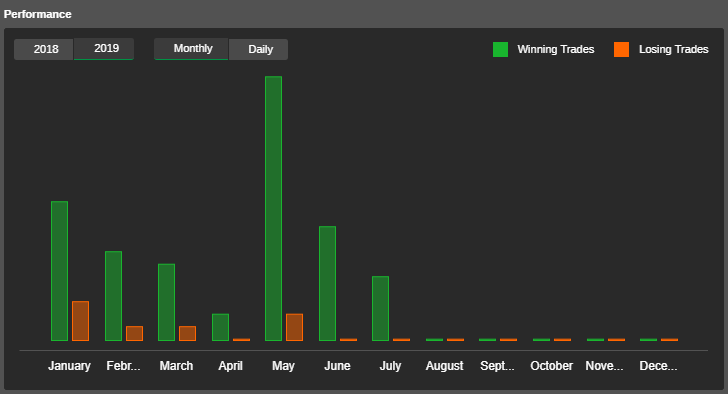
Performance chart:
And volume breakdown:
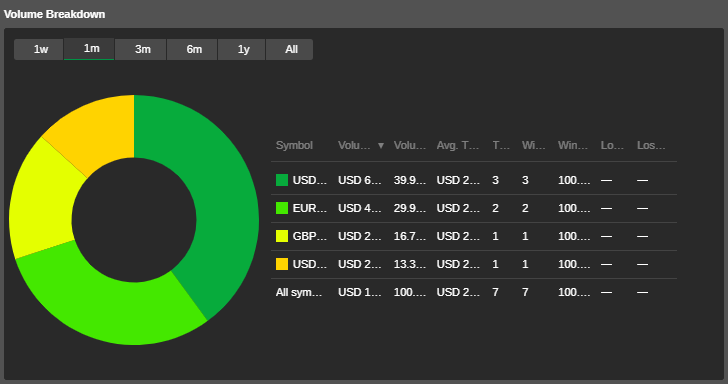
A slew of other metrics is also available for your assessment of the provided strategies.
cTrader's copy trading is based on a fee structure composed of three components:
- Management fee (%) — a percentage of investor's allocated funds per year (calculated and paid on a monthly basis).
- Performance fee (%) — a percentage of investor's ROI paid each month.
- Volume fee ($) — a fixed money amount per lot size traded, charged on every trade.
Trades are copied
Becoming a strategy provider is quite easy and you get to control many variables of the copy trading process, including the fee structure and a choice of whether the strategy will be public or
Overall, the copy trading system is set up to be convenient both to traders and to investors. The only major drawback right now is the low number of strategies available for copying — just over two hundred.
Analysis
Clicking the Analyze menu item in cTrader brings up a summary and performance stats of all trading performed in the current account. The report contains all the basic metrics for performance assessment with charts and tables that can be broken down by time period and by symbol.

Same as with cBot performance analysis, the reports are good but not excellent — there are better alternatives. Nevertheless, the metrics provided here would probably be enough for 99% of traders.
Conclusion
So, how does cTrader compare to MetaTrader, NinjaTrader, or TradingView? Not bad. cTrader is definitely a good platform and has plenty of tools to offer to traders. It is quite possible that you won't find all the specific features you would like to employ for trading in cTrader alone. But, in the real world, it's not a big problem — no one prevents you from using cTrader in combination with MetaTrader, TradingView, TradeStation, and any other platform that helps you to achieve your goals.
The best thing about trading Forex online is that you don't have to limit your software choice with a single platform when it is not only possible but seems quite reasonable that multiple platforms will help you to reach a whole new level at planning and executing trades.
While on MT4's peak popularity level, it has often been the case that traders used MetaTrader 4 to generate trading signals (with custom EAs or indicators) and then execute them on their broker's obscure platform, it might be time for traders to use several platforms for analysis and a different set of more than one platform to execute them optimally.
If you want to share a story of your experience trading in (or using some other aspect of) cTrader platform, please feel free to do so on our Forex forum.