Sentiment Analysis
We use three types of analysis to forecast Forex prices — fundamental analysis, technical analysis, and sentiment analysis. Of the three, sentiment analysis is by far the most important. It is also the most slippery since sentiment is about crowd psychology. Famed Forex speculator George Soros acknowledged that sentiment comes first, writing in The Alchemy of Finance:
Our success or failure will rest on our ability to anticipate prevailing expectations and not real-world developments.
For example, we can have a chart showing that the USD/JPY was horribly oversold on all technical indicators, and at the same time, fundamental analysis showing the dollar/yen was hugely undervalued on every count — and yet the dollar/yen was falling. This is the triumph of sentiment over the other analysis modes. We see the same thing in the GBP/USD — when traders start gunning for sterling, it falls hard, regardless of the technical and fundamental factors.
Sentiment can be like a horse running away with the bit in its teeth. It can also be like a panicked rabbit reversing directions every few minutes. This reveals that sentiment comes in a short-term variety and a long-term variety. One of the problems with trying to nail down sentiment is differentiating between the two time horizons. On the whole, short-term sentiment is literally fleeting and does not last long.
Short-term sentiment can be the cause of temporary corrective pullbacks but generally resolves itself back in the direction of the pre-existing long-term bias. This is because sentiment is based on expectations, and once expectations are formed, they tend to stick like glue. Old expectations are very hard to get rid of. When in doubt about where sentiment lies, that is the time to check the CFTC Commitments of Traders report and also the chart, but these measures can be misleading. In fact, we never really know when sentiment has shifted until after it has occurred. Long-term sentiment lasts months and sometimes years. This is why we can easily see long-term trends on big-picture charts. The monthly euro chart is depicted below. The euro was on an upswing from 2000 to near the end of 2008. That is a case of pro-euro sentiment.
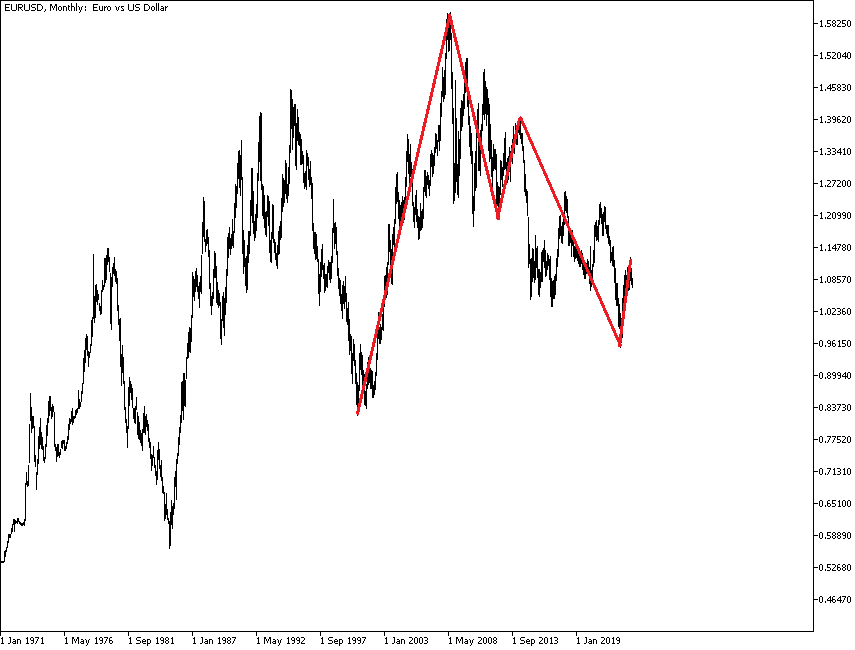
The EUR/USD had a persistent long-term bias to the upside that reasserts itself repeatedly. We speculate that this arose from the European Central Bank having a single mandate of controlling inflation and global investors having confidence in its determination and capability – the credibility of the ECB is rock-hard. In a period when the ECB may be cutting rates, the euro gets wobbly and falls, even when cutting rates is the correct monetary policy. The euro fell in October 2013 ahead of the November cut and again in early April 2014 when the ECB policy board did not cut but promised that it stands ready to cut. Obviously, there is nothing inherently inflationary about cutting rates when inflation is actually near zero and negative in some member countries, and yet the global investors’ fear of inflation was so powerful that the euro was sold off on the idea of a cut. The euro continued to fall and accelerated its freefall in September 2014 after the ECB cut interest rates after all. Surprisingly, the euro rebounded in March 2016 despite the ECB slashing interest rates further to zero. But the bounce did not last long, and EUR/USD was meandering between gains and losses since. The shared eurozone currency returned to decline in June 2021 and continued to fall despite the ECB starting to raise interest rates in July 2022. The euro reversed its decline only in November 2022 as the ECB continued to increase rates, and it was evident that rate hikes would likely continue amid the inflationary pressure. Despite that, it seems that the euro has lost its long-term bullish bias, at least for now.
Fear of inflation, when inflation is near zero, is irrational and points out another feature of sentiment — it is based on models or paradigms that form our expectations. Just about every knee-jerk response to a new bit of data can be debated and refuted in more careful and thoughtful analysis, but careful and thoughtful analysis is not what drives market prices. We see what we expect to see, and a prevailing bias will almost always be perceived as validated by the latest news, even when the latest news directly contradicts the bias. This is why you will see news accounts that say “Sterling fell because of xyz coming in below expectations” or “Sterling fell despite xyz coming in well above expectations.” When traders are gunning for sterling, the actual data will be interpreted in a way that favors the existing bias.
It is important in evaluating sentiment to acknowledge that self-perpetuating feedback loops — what Soros named reflexivity (where cause and effect are hopelessly jumbled) — are not studied by economists and theoreticians and certainly not reported by journalists. This is why we say “Be careful what you read.” We often see stories in the financial press that assert a specific sentiment has either formed or will soon be forming, and the writer is making it up out of whole cloth. This is wishful thinking or some other intellectual defect, but if the story promotes the expectations bias already in place, traders will jump on the story without considering whether it is actually true and useful.
Therefore, a successful Forex trader does not bother trying to forecast important factors like GDP, wage growth, and other core values in judging an economy. We have economists for that job. What the Forex trader needs to know is the consensus bias and any authentic threats to that bias. A really good example is the prevalence of the doom-and-gloom analysts who believed that the Federal Reserve would continue quantitative easing for many, many years. After QE1, QE2, etc., they named it “QE infinity.” When the idea of tapering QE was introduced in May 2013, the market was positioned wrong and overreacted — yields rose abruptly in what was named a “taper tantrum.” Even after tapering was finally begun in December 2013, many analysts believed that the then-new Fed chief was so much more dovish than her predecessor that tapering would be reduced or even postponed. Instead, Fed Chairwoman Yellen affirmed that tapering would continue on schedule and shocked everyone with the additional comment that rate hikes could begin as early as six months after the end of tapering, shortening the expected timeframe for a hike by several months.
The Yellen remark broke a feedback loop. But a careful and thoughtful analysis of the Fed as an institution would have indicated this was always going to happen. Quantitative easing is an extraordinary measure, literally. It interferes with the workings of the free market and, like all government interventions, distorts prices. Distorted prices lead to a misallocation of resources. QE is anathema to all Western (free market) economists, and the Fed is populated by professional free-market economists. To think that the Fed would risk its reputation and credibility for one minute longer than it had to would be to perceive the Fed incorrectly. So here we have the short-term expectation — continue QE indefinitely — running smack into the wall of the long-term expectation — get rid of QE as soon as feasible. In this instance, what we needed to forecast was “institutional” character and not any specific economic data.
Asymmetry and Outdated Expectations
It is amazing how tenaciously traders will cling to a sentiment even after it has been demonstrated to be stale and outdated. Sentiment toward the Fed’s attitude on tapering may have changed, but bond traders did not take US yields higher as would have been expected, nor did the dollar benefit from the improved yield expectation. It was not until the ECB spoke of introducing a cut or other stimulus that the euro fell. This is an asymmetry in the Forex market response that is very common. Bad news reinforces an existing bias, and good news fails to damage an existing bias. It can take a deluge of information contradicting a bias to get a reversal of the bias. For example, 100 basis points in yield differential between the US and the eurozone may prove to be insufficient during prevailing anti-USD sentiment.
How will we know the sentiment is changing? We need hard evidence, and one of the only sources in Forex is the CFTC Commitments of Traders report. When we see the net euro long position start sliding into a net euro short, we will have evidence — not proof, but evidence. Another source of information about changing sentiment is the chart. When we see momentum flagging — higher highs but not higher closes, divergence in MACD, and other indicators — we can guess that traders are growing weary of the current sentiment. Also, big-picture historical support and resistance are often named when there is a whiff of a major change in sentiment.
The problem, of course, is that no indicator tells you how long a move will last. Judging whether a price change is a corrective pullback or a true reversal of sentiment is a perpetual problem in Forex. This is a key instance of why pure chartists — who do not follow the basis of sentiment and trade only on chart events and developments — are at a disadvantage. If you suspect a change in long-term sentiment is occurring because of institutional changes, you can look for them on the chart.