Autochartist Review
Professional traders always use market scanners to scan and identify stocks, bonds, currency pairs, or other assets, which match their investment parameters. While an experienced and successful Forex traders can easily flip through charts to spot trading opportunities easily, it might not be so in the case of a beginner trader. Even a successful trader may miss some profitable trade setups if the number of asset pairs being studied run into hundreds. Thus, it would be beneficial to have an automated program that monitors all the traded assets on a real-time basis and provides a visual display of the best trading opportunities. Autochartist software does precisely that. It was first launched in 2002 to serve the traders of the Johannesburg exchange. As it gained popularity, the service was extended to the US market in 2004. In the next two years, they started serving the commodity and Forex markets. Forex.com was the first Forex broker to offer Autochartist software to its traders in 2006.
Autochartist is the world’s leading fully automated market scanning and analytical tool that covers the entire spectrum of assets traded in financial markets: stocks, currency pairs, commodities, indices, futures, etc. Thus, it would be vital to understand how far the software can go in assisting a trader to be successful. This guide is an attempt to review the abilities and disadvantages of the Autochartist software in detail.
To cater to the needs of all the financial market participants, the Cyprus based Autochartist Limited offers its service mainly through a web interface. However, it also offers a custom plug-in for Forex traders using the MetaTrader 4 platform. To begin with, let us look at the web-based interface.
Autochartist Web Interface
The first notable aspect of the web interface is that all the offered features can be accessed on a single page. So, a trader does not need to go back and forth while using the web interface.
As soon as a trader logs in, by default, the web interface displays the charts of those assets that offer trading opportunities at that point in time. The self-illustrative charts clearly indicate the nature of pattern found, key support/resistance levels, target price, time at which the pattern was identified, the probability of success, ticker symbol of asset, and the market where it is traded.
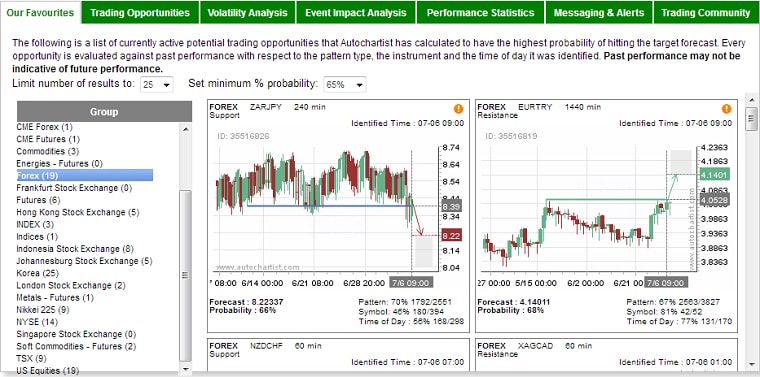
Alongside the charts, the assets are clubbed together according to the market where they are traded and then listed under the Group tab in alphabetical order for easy selection. So, for example, all the latest opportunities in the foreign exchange market, as identified by the Autochartist software, will be available under the Forex section of the Group tab.
The primary intention of displaying all the trading opportunities under Our Favorites tab is to enable a beginner to get a feel of what is being offered. Still, it allows a user to limit the number of results from a minimum of 5 to a maximum of 25 using the drop-down list. Furthermore, a user can filter the available opportunities on the basis of minimum probability of success (between 60% and 80%, using 5% increments) evaluated against past performance with respect to the pattern type, instrument, and the time of day when it was identified. When a new pattern is identified, a white color exclamation mark on orange background is shown next to the search name on the chart.
Custom Monitoring
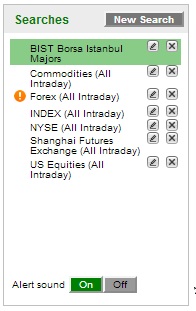
At the time of signing up with Autochartist, you are asked (through a checkbox) to choose a list of assets that you want to monitor for trading opportunities. The Autochartist software uses the list to scan for patterns. Under the Searches link of the Trading opportunities tab, all the assets, which you have selected at the time of signing up, are listed. The New Search tab also facilitates the addition of new assets to your Searches list in the future. If a new trading opportunity comes up, the web interface provides us a sound alert on a real-time basis.
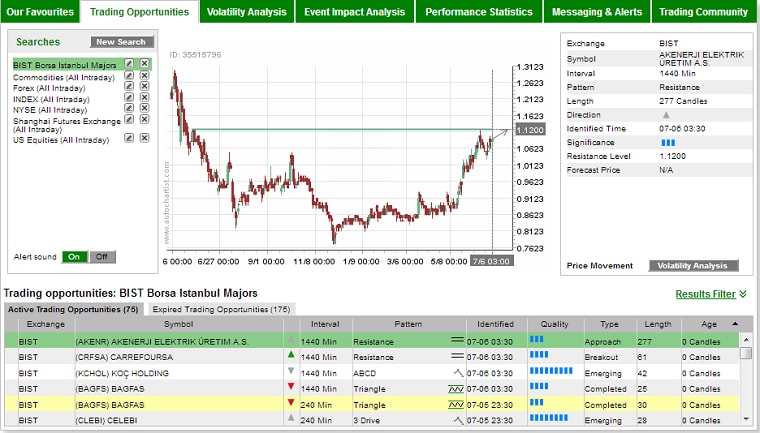
By visiting the Trading Opportunities tab, the details relevant to the new trading opportunity (according to your choice of assets) can be studied. A real-time price chart of the asset with a visual display of the pattern that is being formed or the key support/resistance levels to which the asset’s price is heading for is also provided in the Trading Opportunities tab.
Additionally, the following details are also provided along with the chart:
- Traded exchange – mentioned as Forex in case of a currency pair.
- Symbol – ticker symbol in the case of a stock traded in an exchange.
- Chart timeframe in which the pattern was found.
- Name of the pattern – Autochartist has the ability to identify the following patterns:
- Triangles (ascending, descending, and symmetrical)
- Channels (up and down)
- Rectangles
- Wedges (rising and falling – continuation and reversal)
- Head and Shoulders (plus inverse Head and Shoulders)
- Double top and Double bottom
- Triple top and Triple bottom
Additionally, it can identify:
- Main support/resistance levels
- Fibonacci retracements and extensions
- ABCD
- Gartley (harmonic pattern)
- Butterfly (harmonic pattern)
- Length of the pattern (candle count). For example, a pattern with the length of 20 found on H1 chart would mean that the pattern was formed over 20 hours.
- Trend (up or down).
- Time of identification – indicates the time at which the key support/resistance level was hit.
- Whether the pattern is a continuation or reversal pattern.
- Forecast price – it is also shown in the chart as a gray box. For quick reference, an arrow connecting the current price to the target level is also provided.
The Autochartist tool also provides some crucial details that would enable a trader to assess the strength of a pattern. The details are displayed in the form of a series of bands (similar to the signal strength shown on a mobile phone). The band count varies from 1 to 10.
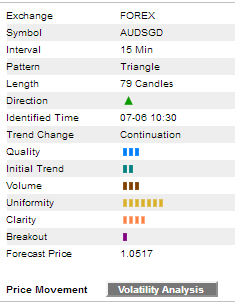
- Initial trend – indicates the quality of strength preceding the pattern. A high quality pattern will have a long and steady trend.
- Uniformity – reflects the uniformity in the space between crucial points that overlap the support and resistance levels.
- Clarity – indicates the smoothness of a pattern. A pattern that lacks clarity will have several random price movements.
- Breakout – indicates the decisiveness of the breakout.
- Volume – shows the relative increase in volume at the time of breakout through the support or resistance level.
- Quality – an average of all the indicators discussed above.
Volatility Analysis
The Autochartist software also provides volatility analysis of an asset being monitored by a trader. The study shows the probable price range for the next 15 minutes, 30 minutes, 1 hour, 4 hours, and the entire day in form of a graph. Also, the hourly price movement range along with the average for the past 11 hours is shown on the chart. Similarly, the price movement range per day and its average is shown for each day of the week beginning on Monday.
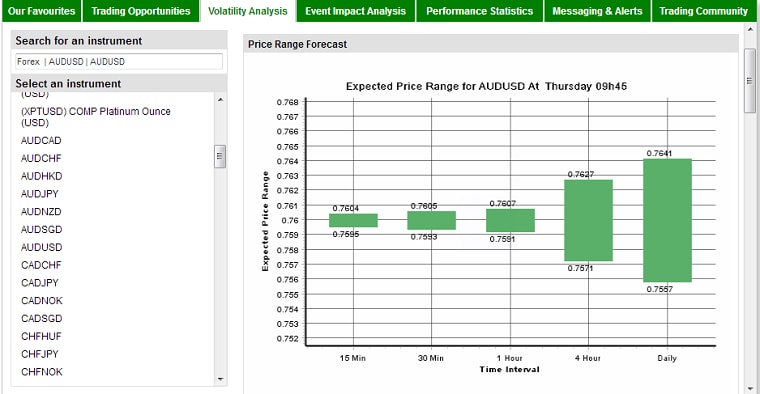
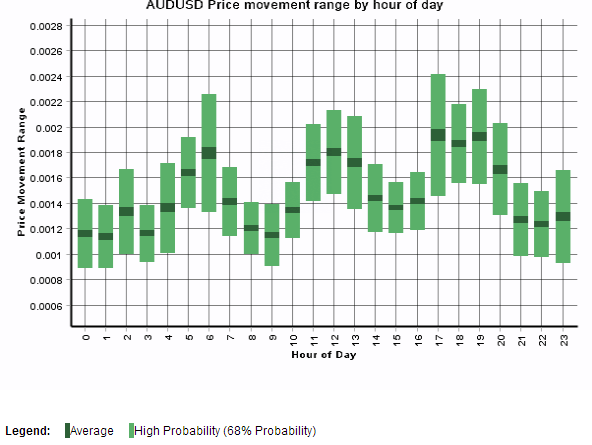
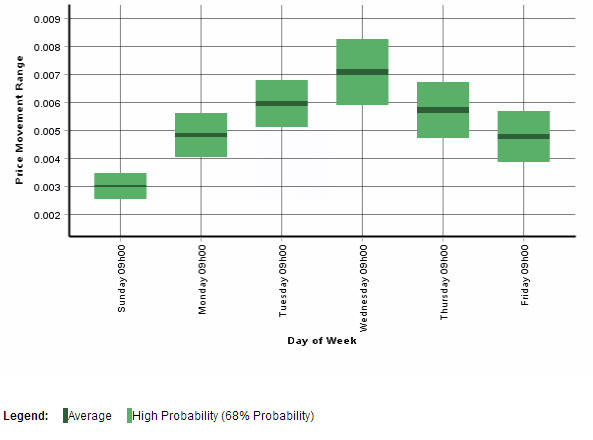
In all cases, the probability of achieving the price range is also shown. All details pertaining to volatility analysis can be downloaded in the form of an Excel sheet. The details enable a trader to identify the best time to trade an asset and to fine tune the entries and exits.
Filtering of Results
The expandable Results Filter provides quick reference to the available opportunities. The checkboxes can be used to filter through completed/emerging chart patterns or Fibonacci formations. Even the key level breakouts and approaches can be selected or skipped as per the requirement.
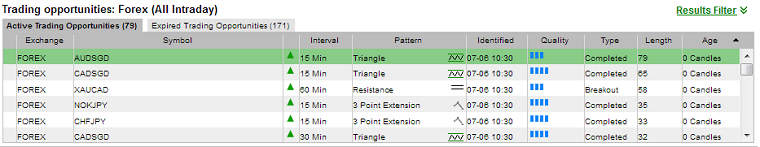
The neatly organized table not only presents the crucial details about the active trading opportunities (exchange, symbol, trend, timeframe, name of the pattern, identified time, quality, type – emerging, completed or approaching, length, and age – how many candles have passed after the formation), but also the expired trading opportunities. That enables a trader to validate the past performance according to the personal requirements.
Event Impact Analysis
The Event Impact Analysis tool of Autochartist web interface specifically caters to economic news traders. The tool shows the correlation between a positive or negative economic data and its impact on a currency pair at the end of 4 hours, 12 hours, and 2 days. However, only the most important economic data pertaining to the following countries can be selected for correlation study:
- Australia
- Canada
- France
- Germany
- Great Britain
- Italy
- Japan
- New Zealand
- Switzerland
- United States
- European Monetary Union
Traders can study the impact of an economic data on the following pairs:
- AUD/USD
- EUR/USD
- GBP/USD
- NZD/USD
- USD/CAD
- USD/CHF
- USD/JPY
- USD/ZAR
- XAG/USD
- XAU/USD
For example, a trader can check whether there is a correlation between Australia’s GDP data and the movement of USD/ZAR (US dollar vs. South African rand), 4 hours, 12 hours, or 2 days after the news is released.
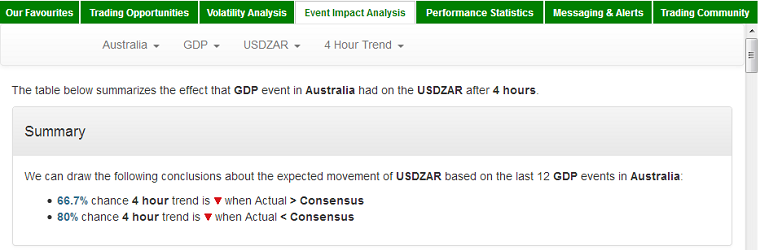
Autochartist shows if there is any correlation. When there is no significant correlation, it is mentioned as well. For an unknown reason, currency pairs such as USD/MXN and EUR/GBP, and commodities such as oil and natural gas are not available for event impact analysis.
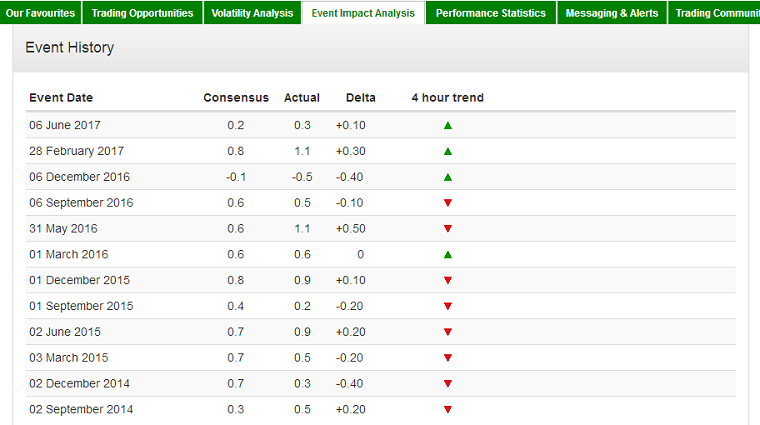
Additionally, for quick reference, the most recent 12 data release events and the currency pair’s charts are also displayed. The price charts also provide a visual display of an event’s impact on a currency pair at the end of the selected time period of study. The Delta value for each of the 12 economic news releases would also enable a trader to understand whether there is a significant increase or decrease in correlation.
Alerts
By default, when you sign up for the service, Autochartist web interface begins sending us alerts via email. The alerts or Market snapshot emails are sent only for the assets selected at the time of signing up. However, the checkbox enables a trader to select or deselect assets according to his or her requirements. A trader can also unsubscribe from receiving any emails at all.
For currencies and commodities, Autochartist can send up to three alerts a day, one each during the Asian, European, and the US sessions. However, using the checkbox, a trader can avoid receiving the alerts or restrict the alerts to a minimum of one. In case of stocks, alerts are sent once a day for Tokyo, New York, and London stock trading sessions. Alerts can be received in any of the 21 languages in addition to English. A trader can even choose to receive alerts in multiple languages.
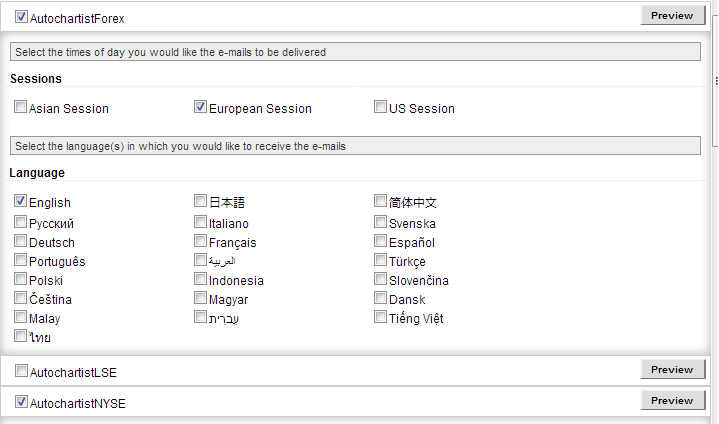
In addition to Market snapshots, a Forex trader can choose to receive correlation signals separately. The alerts are sent in any of the 22 languages chosen by the trader. Even alerts of high impact financial news releases can be received separately via email. A trader can choose to receive financial news events related to one or all of the three sessions (Asian, European, American). The list of events for which alerts are sent is also provided. There is also a provision to add a particular event to Outlook/Google calendar.
Performance Analysis of Autochartist Tool
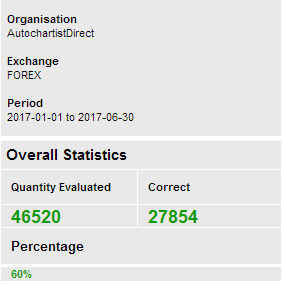
Finally, a market scanner of this magnitude can be considered credible only when there is a detailed track record of performance, and Autochartist provides that as well. For each market (stocks, commodities, Forex, etc.) and individual assets thereof, a detailed report is provided.
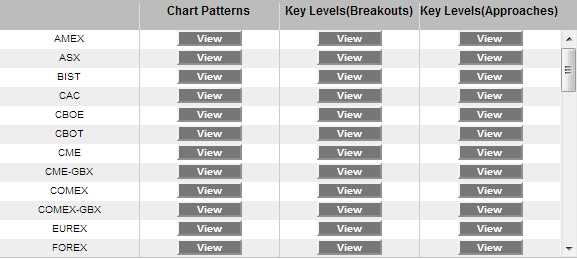
The performance is analyzed separately for the identified chart patterns and key levels – breakouts and approaches. Furthermore, the validation is done using the data for the past 6 months. The total number of patterns evaluated, the number of correct patterns, and the percentage of success is provided at the beginning of the analysis. That would please traders who are not interested in munching through a pile of statistical data.
For expert traders, a detailed analysis is provided as follows:
On the basis of chart patterns, the Autochartist software provides a study of success rate:
- by the pattern name;
- by the pattern name and direction;
- on the basis of direction (up and down);
- on the basis of timeframe of analysis (M30, H1, H4, D1)
- broken down by data interval and direction;
- of pattern broken down by symbol for every interval (M30, H1, H4, D1);
- based on pattern name and direction;
- for different hours of the day (UTC-4 timezone);
- based on pattern name and data interval (M30, H1, H4, D1);
- broken down by data interval and hour of the day.
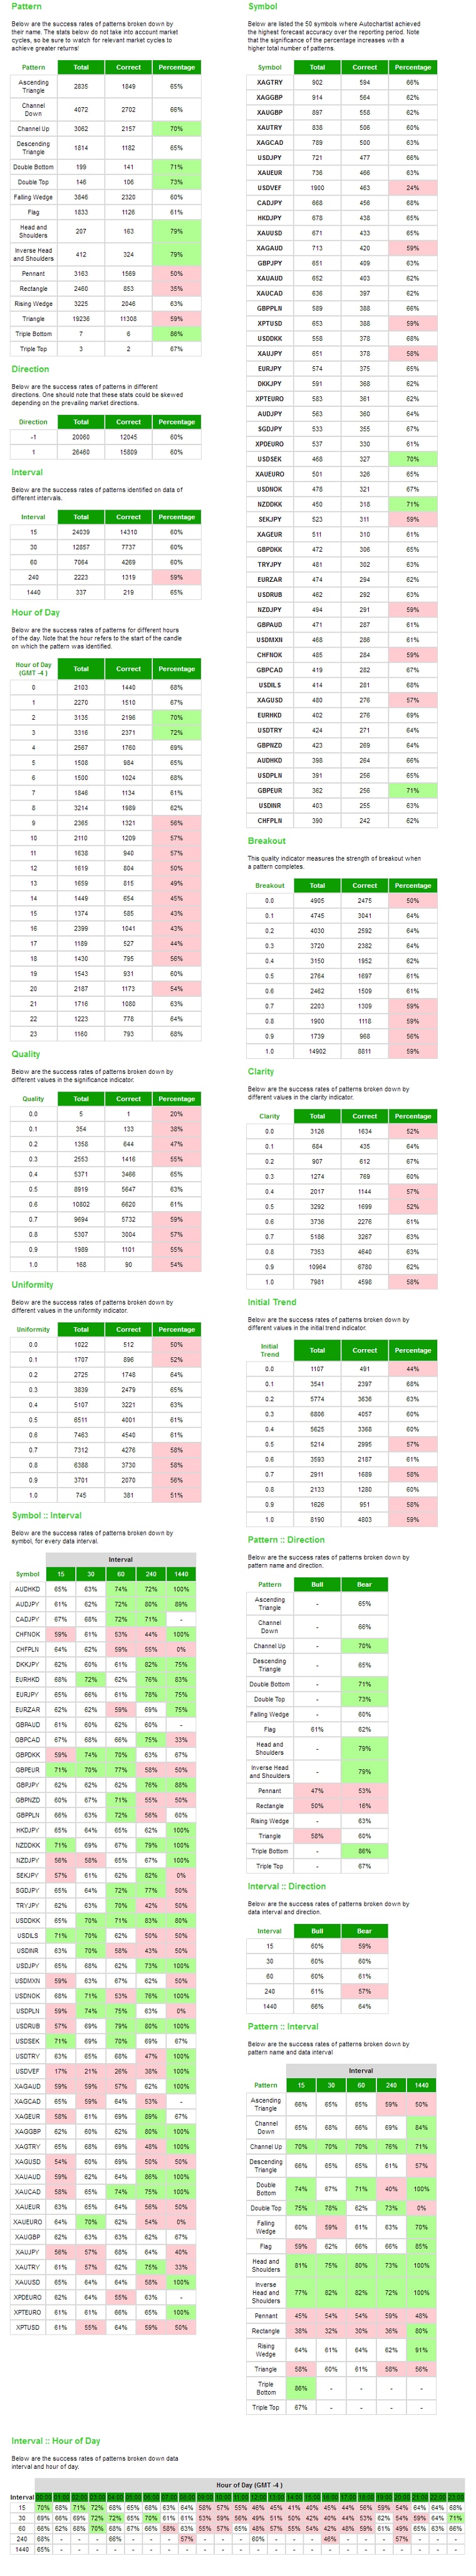
Additionally, a list of 50 symbols where the Autochartist tool achieved the highest accuracy is provided. Furthermore, the total number of chart patterns identified for each asset and their corresponding success ratio are also offered for study.
On the basis of key levels (breakouts and approaches), Autochartist provides a study of success rate:
- broken down by the level's name (support/resistance);
- on the basis of direction (up/down);
- on the basis of time period of analysis (M30, H1, H4, D1);
- for different hours of the day (UTC-4 timezone);
- broken down by symbol for every time interval (M30, H1, H4, D1);
- by data interval and direction;
- by level (resistance/support) and data interval;
- broken down by data interval and hour of the day.
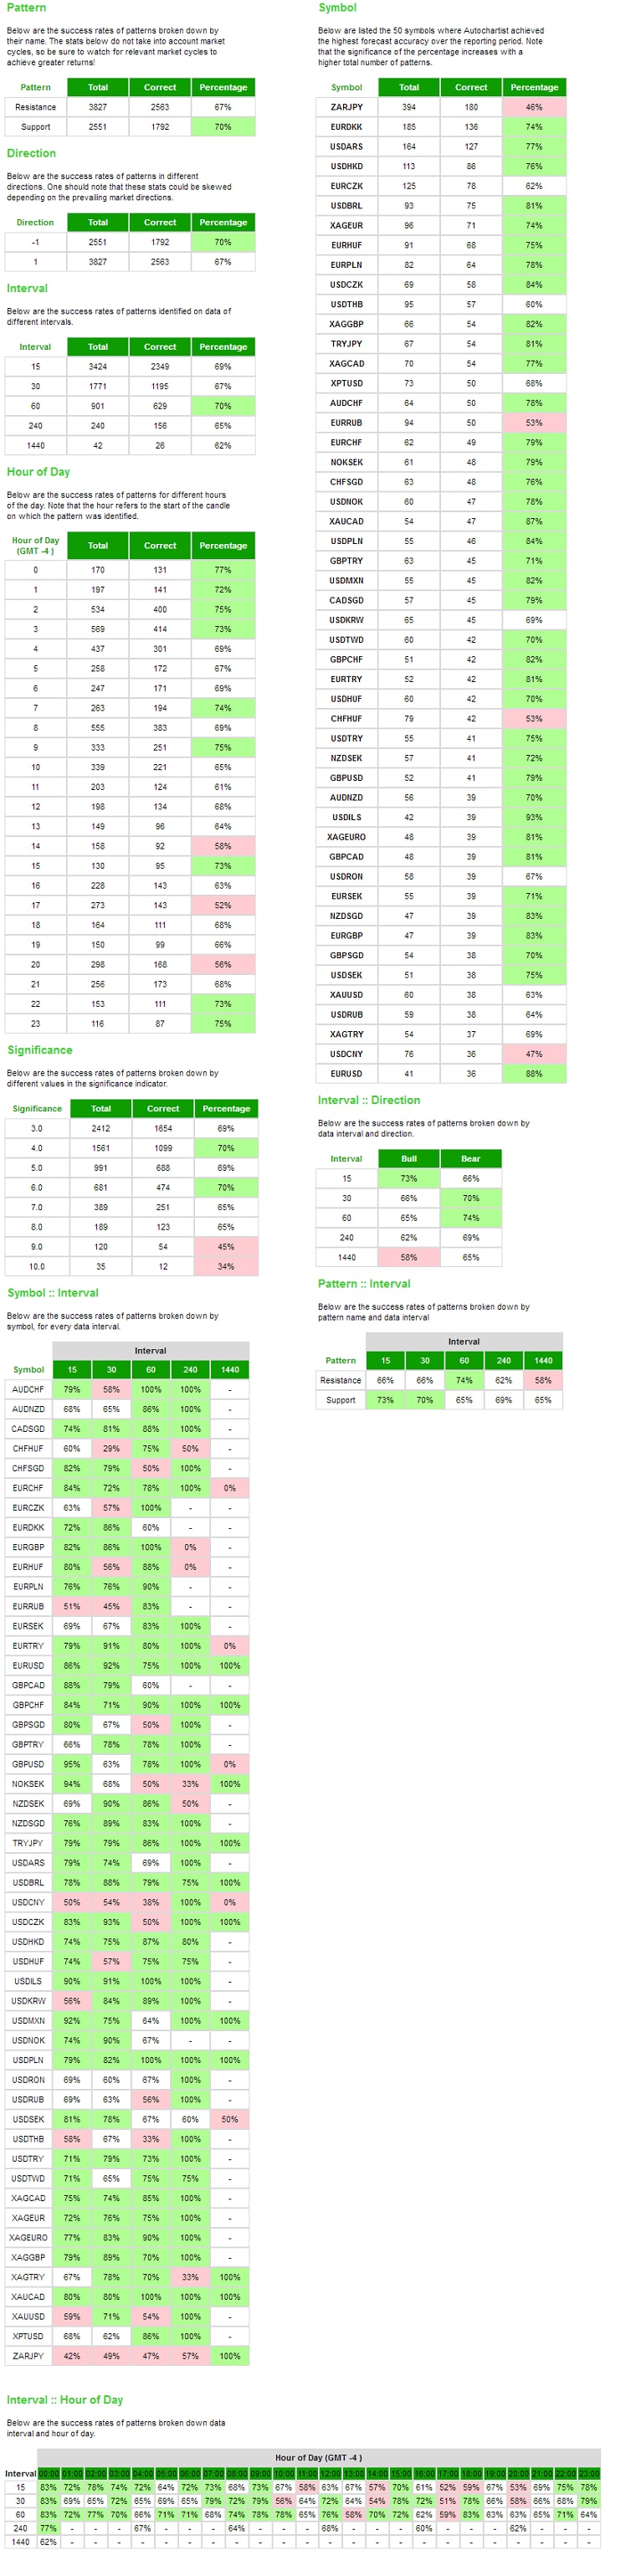
Additionally, a list of 50 symbols where the Autochartist tool achieved the highest accuracy is also provided. Furthermore, total number of key levels identified for every asset and the corresponding success percentage are also offered for study.
Earlier in this guide, we had mentioned that Autochartist tool provides important details regarding the strength of the pattern in the form of bands. The performance statistics also provide an in-depth study of the success rate for the indicators of clarity, uniformity, quality, and initial trend.
A success rate of 70% or higher is highlighted in light green color, while a success rate below 60% is highlighted in light pink color.
MT4 Plug-in
Taking into account the popularity of MetaTrader 4 and MetaTrader 5 platforms among Forex and CFD traders, Autochartist has come up with a plug-in, which can provide almost all the features of the web interface inside the MetaTrader platform. The plug-in is also available for JForex platform as well. However, after the trial period, a trader should either subscribe to their services (direct user subscriber) or open a trading account with one of the Forex brokers listed on their website. If you already have an existing account with a Forex broker listed on their website, then you may continue to make use of the facility for free.
Once the Autochartist expert advisor is dragged onto a chart, it will connect to the Autochartist server and retrieve all the patterns identified in accordance to the assets offered by the trader’s Forex broker. Using the Display all symbols checkbox facility, a trader can restrict the expert advisor to retrieve the data for only a single currency pair.
Similar to the web interface, the subwindow on the MT4 chart provides the list of currency pairs and the pattern being formed. A trader can view all the patterns or filter on the basis of probability of success, which ranges from 60% to 80%.
Using the settings, a trader can subscribe to one or more reports in multiple languages. Additionally, a trader can also choose to receive reports for one or more sessions (Asia/Europe/USA). A filter facility is also provided to view the completed or emerging key levels, chart or Fibonacci pattern according to the timeframe of choice. A trader can study the performance statistics using the links provided in the web button.
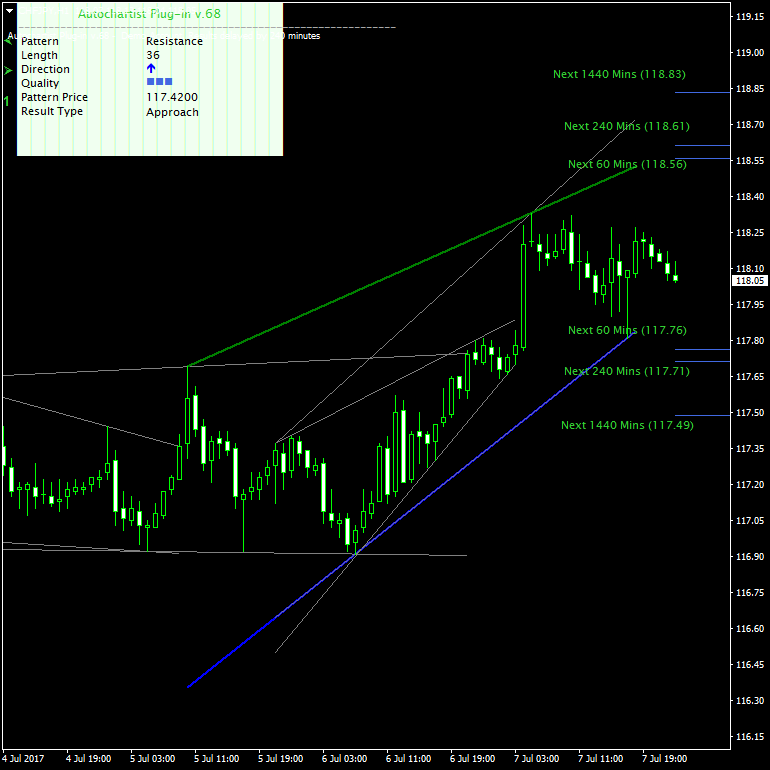
Once the symbol on the subwindow is clicked, a custom DLL imports relevant data from the Autochartist server and provides a visual display of the chart patterns, Fibo levels, support/resistance, and other important details. Thus, it avoids the need to keep multiple charts open at the same time. The volatility range for different timeframes are plotted on the chart. Even the strength of a pattern can be studied in detail using the Details window.
The price chart of CHF/JPY provided below has no new chart patterns. However, the key levels (resistance) and the probable price range for the next H1, H4, and D1 are shown.
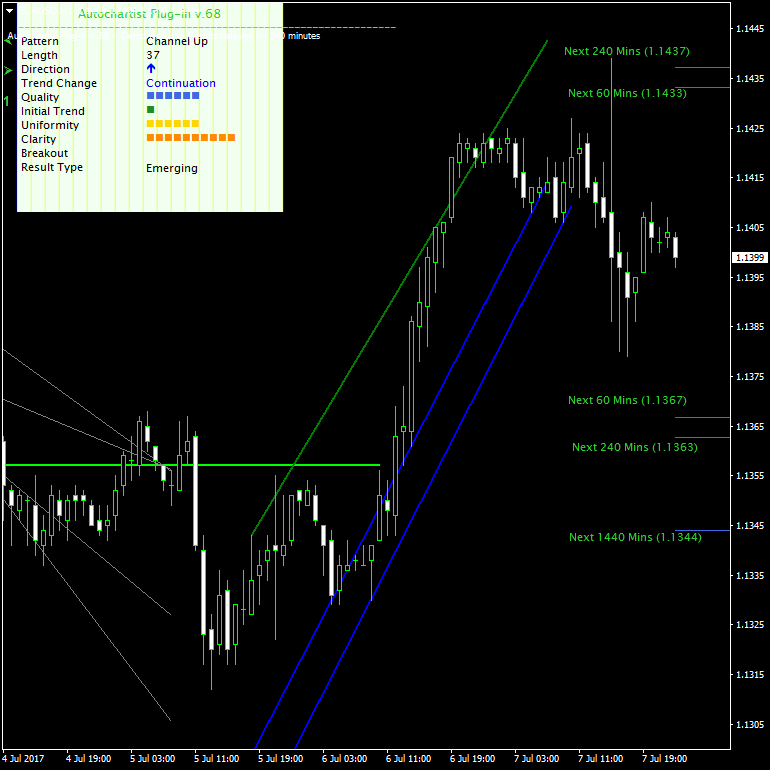
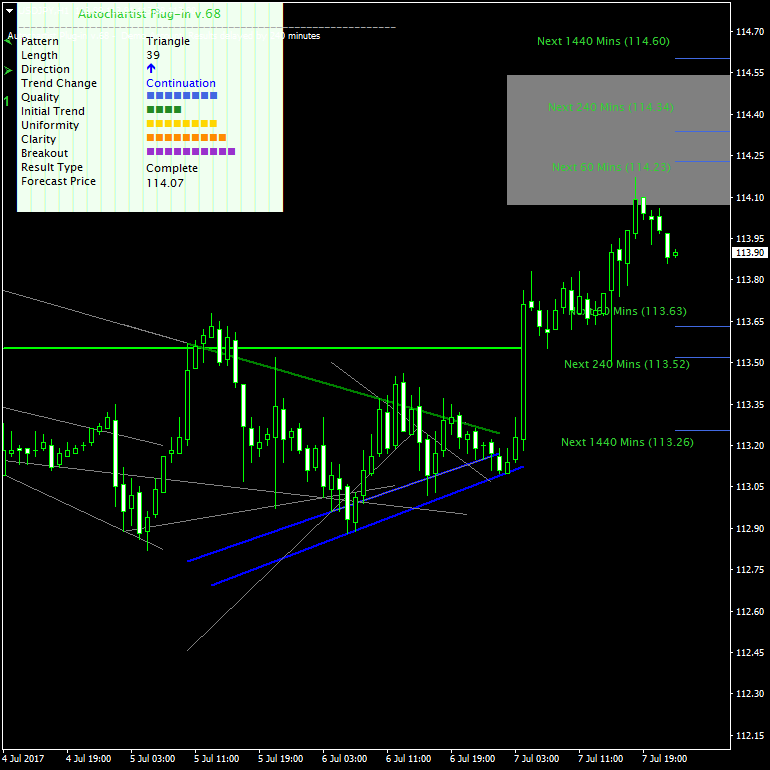
An emerging EUR/USD continuation pattern and a completed USD/JPY triangle pattern are shown below.
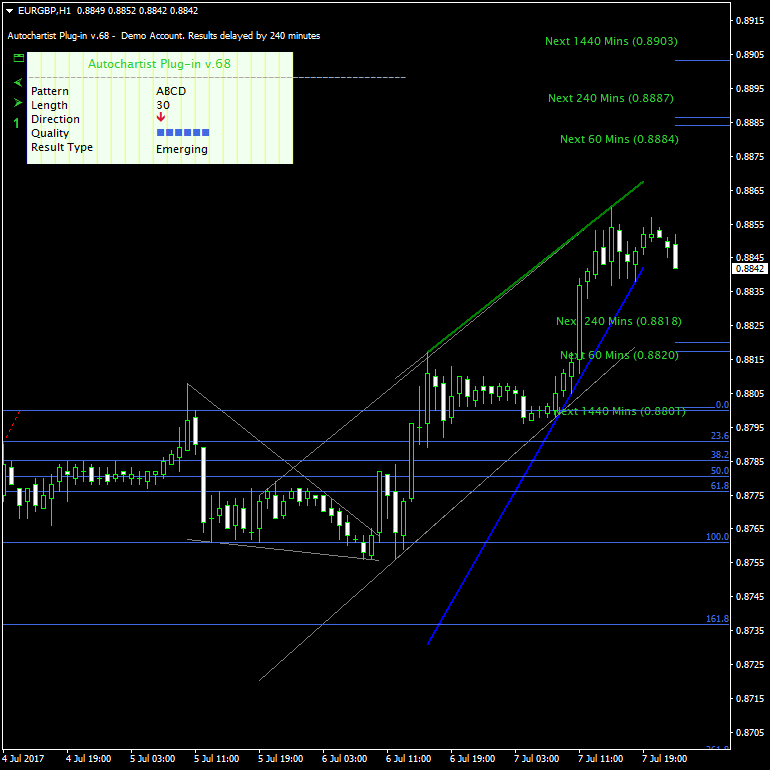
The chart of EUR/GBP pair, which has formed an ABCD pattern is shown below. The Fibonacci levels and the probable price range are also shown.
Educational Materials
In the Trading community section, Autochartist has also provided ample amount of educational materials in form of PDF documents and videos for traders to understand the different kinds of patterns, Fibonacci ratios, and key levels. There are also videos that explain how to make use of the available tools for maximum benefit. Notably, they have also provided a document that teaches the importance of discipline in trading.
Pros and Cons
The list of Autochartist's advantages includes:
- Enables a trader to monitor hundreds of assets on a 24×7 basis.
- Theoretically, no trading opportunity is missed.
- Since the key levels along with the target are specified, a trader has to spend only minimal amount of time on analysis.
- Free of cost if you are a client of one of the Forex brokers listed on their website.
- Allows easy customization as required by a trader.
The software's disadvantages are listed below:
- The MT4/MT5 plug-in requires the use of custom DLLs, which can be dangerous from the security point of view.
- Autochartist tool only provides an indication of where a currency pair or any other asset could be heading. It should not be used blindly as a sort of a "market prophet". Analytical thinking is necessary before taking trading decisions.
- Relying on a third-party tool for your analysis can be dangerous because the controlling organization might change how the software works (and performs) anytime and without prior notification.
If you want to get news of the most recent updates to our guides or anything else related to Forex trading, you can subscribe to our monthly newsletter.