Which Type of Chart Is the Best?
Your choice of chart format is entirely up to you, although each has its uses. You may not like the candlestick format, but you should become familiar with it because it is by far the most popular type of chart you will see. It could put you at a disadvantage if your eye does not immediately adapt to it.
In a way, your choice of chart reflects how much noise your eye can cope with. A line chart has no noise but a low level of information. A bar chart has details but sometimes too much — it is noisy.
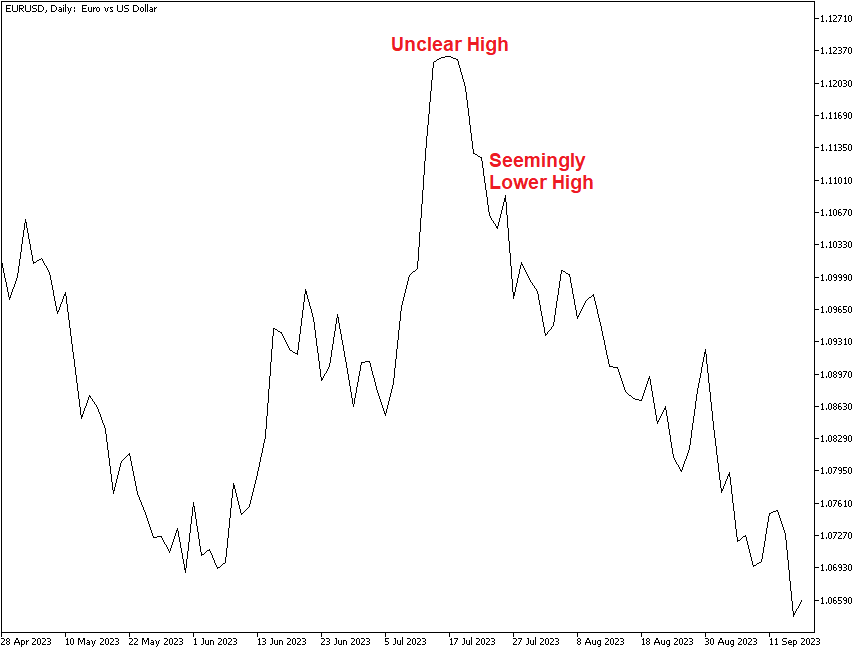
Line charts contain the least detail, but by blocking out extraneous information, provide an instant sense of direction and slope (momentum) — or the absence of trendedness and momentum. Line charts can be misleading, though, because connecting just the closes withholds new highs and lows. On the chart below, it is hard to see the specific date and level of the highest high. Furthermore, it looks like the currency pair was continuously falling till the end of August, logging lower highs all the way.
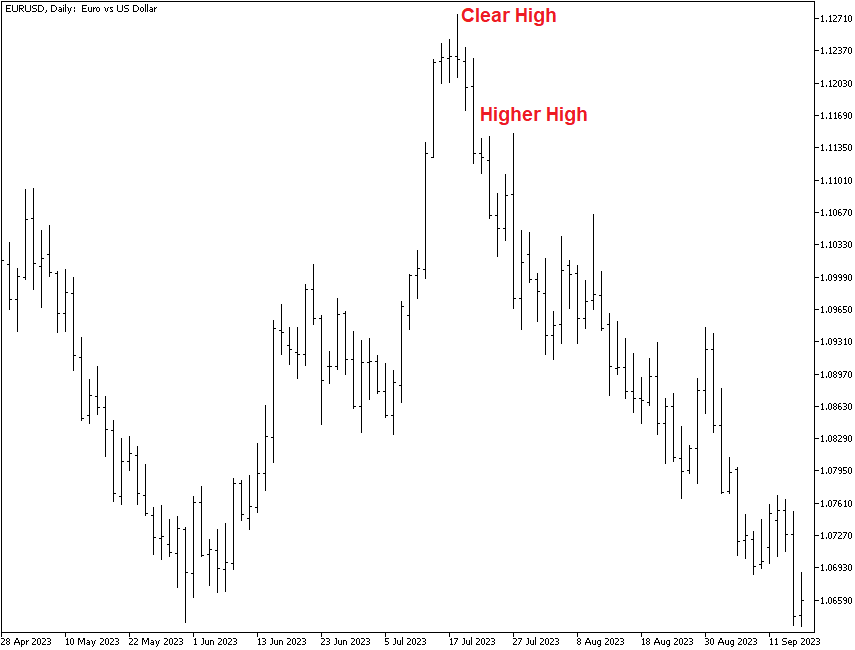
The bar chart, containing all four components (open, high, low, and close), gives more detail. Not only can you see where the actual highest high is located, but you can also see that the currency pair paused its decline, logging a higher high, before resuming the move down. It is much easier to draw support and resistance lines on bar charts than on any other kind of chart. This is because support and resistance are drawn off highs and lows, while the line chart does not have them, and the candlestick chart highlights opens and closes, not highs and lows.
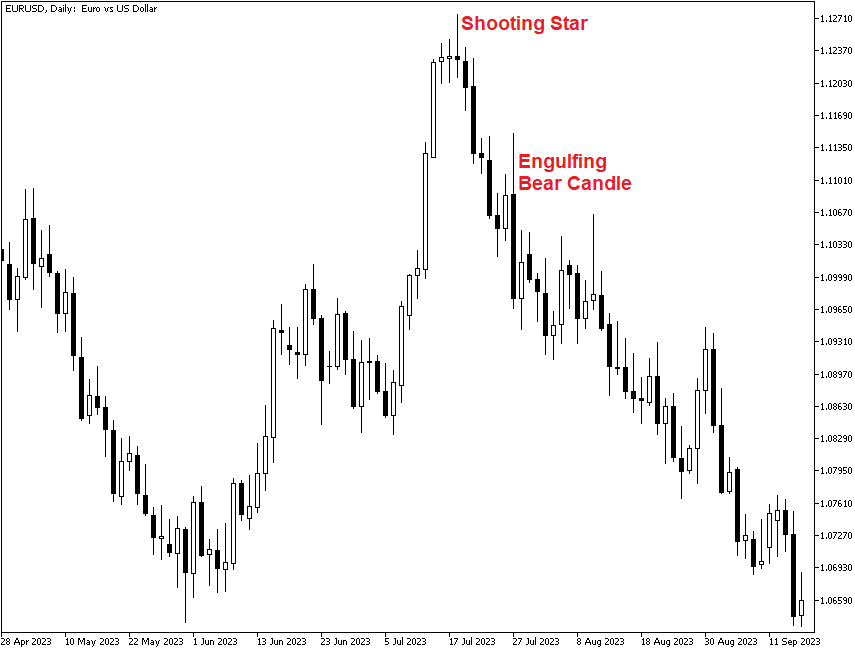
The most eye-catching chart is the candlestick chart. On the example below, you can see that the highest high was on the candle that demonstrated a pattern known as "shooting star", preceded by a couple of "doji" candles. That was a strong signal that the upward trend has run its course and is likely to reverse, which is exactly what happened. Additionally, the candle that seemingly broke the subsequent bearish trend with a higher high was an engulfing bear candle, which suggested that the downtrend remained in place.
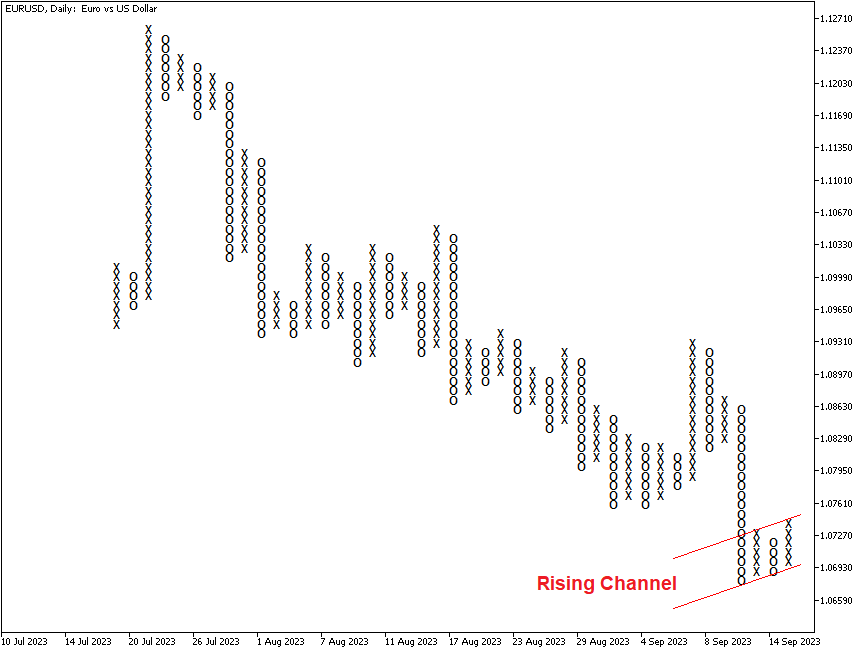
The least easy type of chart to use is the point-and-figure chart. The figure below shows the same data as the other three charts, just reorganized to display net up and down moves. Again, as with the bar chart, you can easily draw support and resistance lines. On this chart, we can see a development not apparent on other charts. It looks like the prices have started a small rebound after the steep decline, forming an ascending channel.
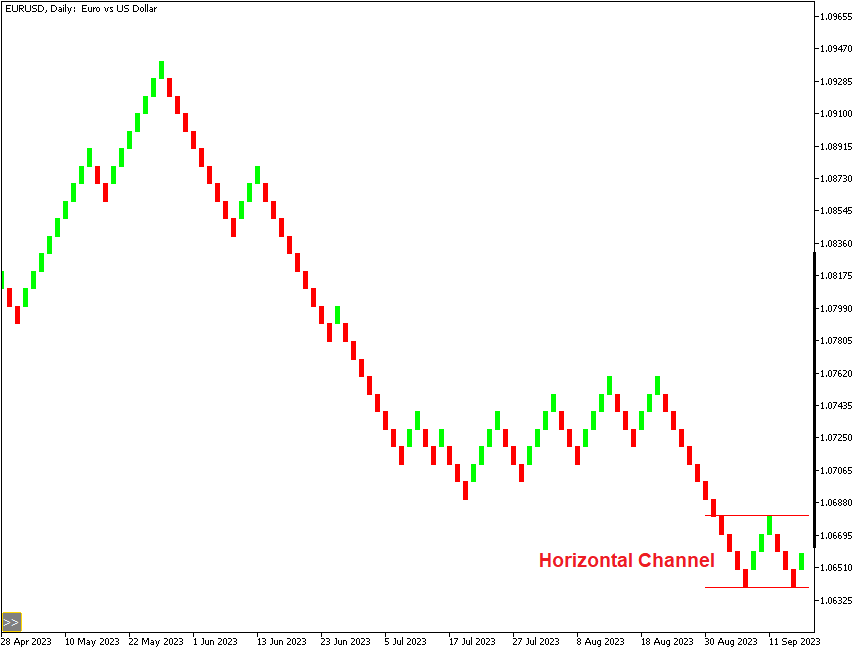
Finally, the Renko chart is a refinement and variation on the point-and-figure chart. A “brick” is put on the chart only if the price has moved in the same direction by a fixed amount. You set the fixed amount, and this is very useful if you are measuring a price move as compared to the average true range or some other measure. If the price moves by enough to add one brick but not two, you can deduce that momentum might still be high and rising but not rising by enough. In the example chart below, we have a horizontal channel instead of the ascending channel we can see on the point and figure chart on the same timeframe.
| Type of Chart | Advantage | Disadvantage |
|
Line |
Easy to see trend/momentum |
No high or low |
|
Bar |
See highest high/lowest low |
Noisy |
|
Candlestick |
Size of the candles suggests the importance |
Takes practice to interpret |
|
Point-and-figure |
Easy buy/sell decision |
Lacks detail |
|
Renko |
Set your own parameters |
Lacks detail |