Traders often wonder whether there is a seasonality to the currency markets and if there is, how it looks. The summer season is usually associated with the whipsawing sideways market that offers few opportunities for day trading. In stock trading, they say: Sell in May and go away. Forex traders rarely employ buy-and-hold strategies, though seasonal factors should influence currencies too.
Seasonal trends in gains and losses
There is no lack of Forex seasonality studies showing the tendencies of currency pairs to gain or lose during particular months based on the statistics of the past years. However, the implications of those studies are of little practical value. It looks like betting on some currency pair to grow in a given month just because the pair rose in the majority of those months during the past several years is folly.
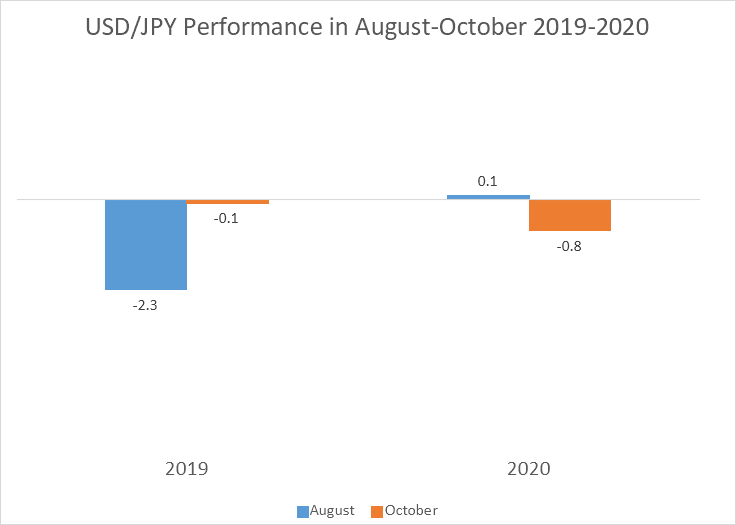
For example, Kathy Lien in her article for Investopedia finds some USD/JPY seasonal cyclicity: October was a bullish month for the currency pair in 68% of the samples during the 1999-2018 period, while August was the least bullish, showing gains only in 32% of the samples. The two subsequent years proved such analysis to be unreliable. The currency pair was almost unchanged in October 2019 and August 2020. Furthermore, it fell in October 2020.
Seasonax chart of the US dollar index for the 46 years from December 1971 to December 2017 suggests that the dollar tends to rise at the start of a year, being especially strong in January, and to fall at the end, being the weakest in December.
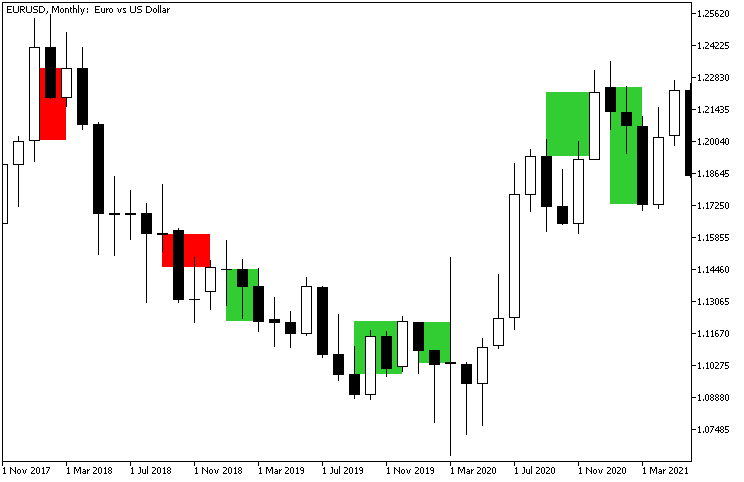
Let's look at the performance of the EUR/USD currency pair over the past few years to see whether the dollar was exhibiting such behavior. One should remember that the EUR/USD chart moves inversely to the dollar performance, meaning that a rise of the currency pair indicates a fall of the greenback and vice versa. That means, according to the Seasonax chart, the pair should be rising from January through March (peaking at the beginning of April) and falling from September till December.
Following the trend in 2018 would result in losses both at the beginning and at the end of the year as EUR/USD rose during the first three months and fell during the last four. That is in complete opposition to the seasonal trend.
The next two years were much more favorable to traders who are following seasonal trends. The currency pair was falling in the January-March period and was rising in the September-December period in both 2019 and 2020.
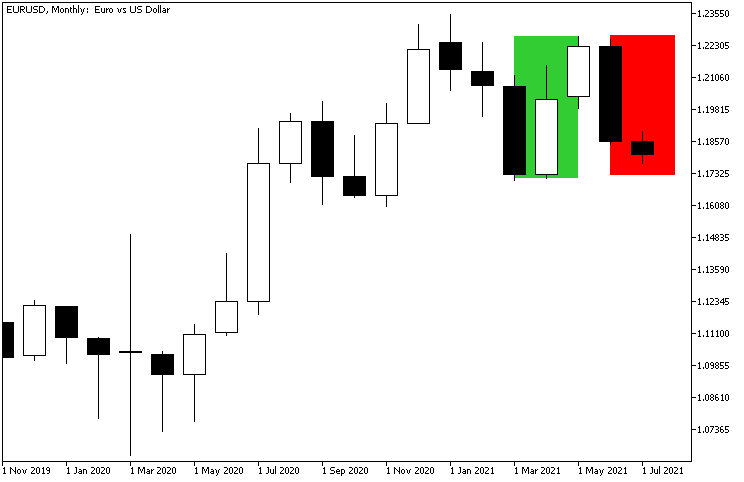
The beginning of 2021 was extremely positive for traders who use seasonality in their trading strategies as the EUR/USD pair demonstrated a significant drop during the first three months of the year.
Overall, it looks like the EUR/USD currency pair started to follow seasonality closer over the past few years. Yet any trader who tried to follow the seasonal trend in 2018 would be devastated. And that highlights the danger of following seasonal trends blindly as there is no telling when a similar situation can occur in the future.
Equity Clock uses data for the 20-year period ending December 31, 2020, to demonstrate a disposition of EUR/USD to rise from March through December. Looking at the currency pair's performance in 2020, so far it doesn't look certain that the pair is going to follow the seasonal cycle. While EUR/USD indeed gained in April and May, it has almost lost its gains by now. And as was discussed previously, the currency pair was falling for almost the whole of 2018 (and 2019 for that matter), meaning that betting on the pair's rise over a year is highly unreliable.
Seasonality of volatility
At the same time, seasonality seems to be an important factor in FX trading because daily ranges (average and median) seem to be narrowing during some months and widening during others. The same can be said about the seasons themselves. There is a fundamental difference in how major currency pairs behave during spring, summer, autumn, and winter. The Forex seasonality study presented below looks at exactly this kind of seasonal effect on trading.
ADR
The study of the foreign exchange seasonality patterns is based on the concept of average daily range (ADR) — the mean number of pips per day the pair has been moving during the period. High ADR (wider High — Low difference) implies more market movement and more intraday volatility to profit from.
Consider a day with zero difference between High and Low — it would be impossible to trade within it. Now, a day with hundreds of pips of a range is a good foundation for entering some trades. Of course, it also means that the price is more likely to go against the trade's direction and hit its stop-loss.
AHR
Calculating the average hourly range (AHR) provides additional information regarding the nature of currency rates volatility. It helps to answer the following question: Is the ADR high or low due to just one rapid price move or is it based on long steady intraday trends? When ADR is significantly higher than AHR, it means the former; a lower difference between ADR and AHR implies a more homogeneous distribution of price movement within the day.
MDR
While average daily range tells us an important thing about the daily ranges — how big they are on average, the median daily range (MDR) helps us to understand what range we are more likely to encounter. ADR gets skewed easily with outlying daily range values. Consider a hundred days with 100 pip movement and two days of 1,000 pip movement. The average of that would be 117.6 while the median would be 100, which obviously is a more useful value to traders in this case.
MHR
Median hourly range (MHR) serves to complement the daily range statistics to improve our understanding of how the daily range relates to hourly ranges. Shall traders expect a multitude of wide-range H1 candles inside each day or is it just a few big intra-hour movements that result in high MDR values?
Percentage
Daily and hourly ranges calculated in pips offer a lot of practical value to market operators. After all, pips times position size produce profit and loss. Overall, the percentage changes in currency rates are very low compared to other financial trading instruments (commodities, equities). FX traders rarely care about the pair's daily loss or gain percent. However, it is the percentage ranges that enable meaningful comparison between several currency pairs because comparing EUR/USD pips with USD/JPY pips is akin to comparing apples to oranges.
The present calculation of the ADR, AHR, MDR, and MHR percentage values uses the average between High and Low as the denominator for each candle.
Data
The years 2006–2021 were chosen for this analysis because of the need for more data. Normally, it is better to go with post-2009 history to avoid the bias from the financial crisis 2007–2008 and also to make the data fresher. However, even the 2006–2021 range yields only 15–16 observations for the sample size, which is very low by any standard.
The last month used to calculate the monthly values is June 2021. The last month used to calculate the seasonal values is May 2021. This is done to avoid a 'partial' July and summer of 2021 from skewing the results.
The study uses 8 currency pairs — all dollar-based: EUR/USD, GBP/USD, USD/JPY, USD/CHF, USD/CAD, AUD/USD, NZD/USD, and USD/SEK. They were chosen because they had enough historical price data in the MetaQuotes demo server, which was used as the data source.
You can download all the presented tables and charts in form of an Excel file by clicking any of the images below.
Seasonality cycles
Pips — EUR, GBP, JPY, CHF
By almost any measure, the most active months for the four currency pairs are January and March. The lowest-range months are less uniform. EUR/USD fares poorly in July and October according to median ranges, and in April, July, and October according to average ranges. GBP/USD is worse off in May and August according to the average values and in July and August according to the median values. USD/JPY is less active in November and December. Swiss franc pair shows less movement in April and July.
Overall, it can be noted that these four currency pairs are most active in winter and spring, and are less active in summer and autumn.
Median values are always lower than the average ones. It means that there are more outlying wide ranges than outlying narrow ranges in the price data. Traders can interpret it in such a way that the period's range will likely be equal to or greater than the median value.
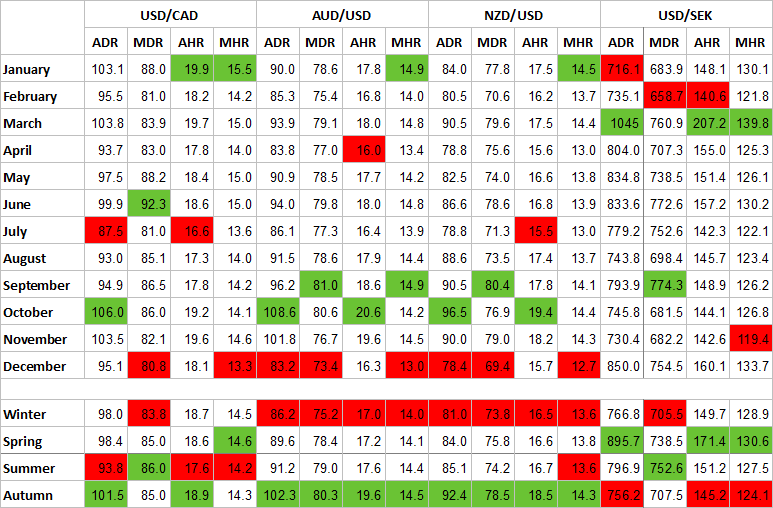
Pips — CAD, AUD, NZD, SEK
Hourly range in USD/CAD is maximized during January while daily ranges are good in June and October. AUD/USD and NZD/USD trade wider in September and October, though the median hourly ranges show good results in January as well. USD/SEK reaches its peak in March. USD/CAD ranges bottom down in July and December. AUD/USD and NZD/USD reach the lowest values in December and, partially, in April and July. USD/SEK fares worst in January, February, and October.
AUD/USD and NZD/USD show somewhat inverse seasonality to the previous set of pairs (EUR/USD, GBP/USD, USD/JPY, USD/CHF) — summer shows the most activity and winter the least in all ranges. It is the expected behavior for South Hemisphere currencies. Meanwhile, summer is the worst month of USD/CAD in all ranges except for the median daily range, in which it is the best month. Otherwise, the pair trades highest in Spring and Autumn. USD/SEK prefers spring and summer and shows the worst results in autumn, though winter is also a weak month for the currency pair.
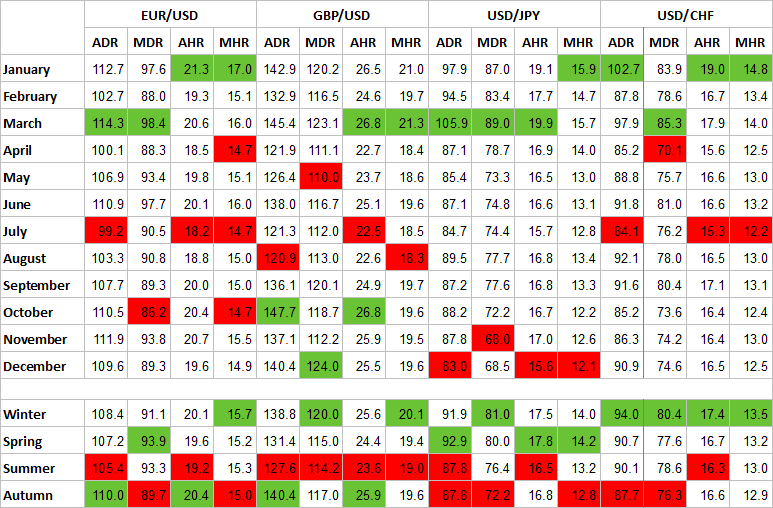
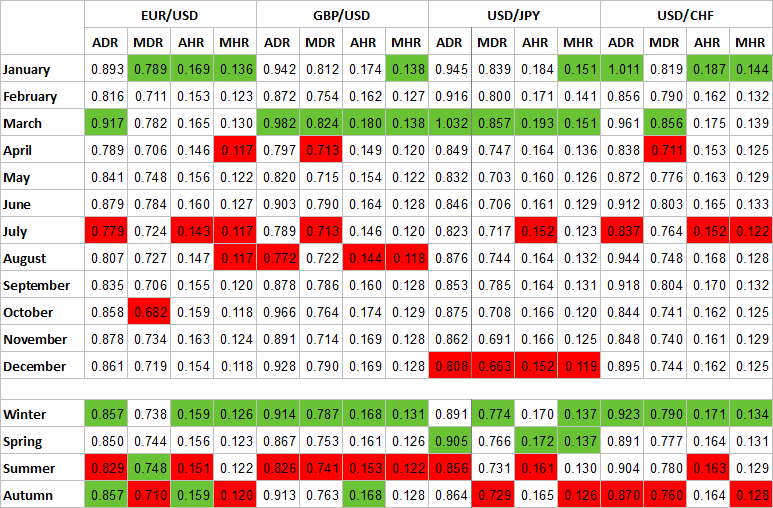
Percentage — EUR, GBP, JPY, CHF
The prominent January and March peaks are retained by all of the four currency pairs when switching to percentage range values. The minimums remained largely the same as well, with EUR/USD faring the worst in July and October, with August also being a bad month for the pair. The worst months for GBP/USD volatility are July and August. USD/JPY ranges are clearly down in December. Minimums in USD/CHF remain unchanged — April and July.
Maximums and minimums by seasons become even more pronounced, with winter and spring boasting wider ranges than summer and autumn for all currency pairs (though EUR/USD has peaks in summer and autumn according to some ranges).
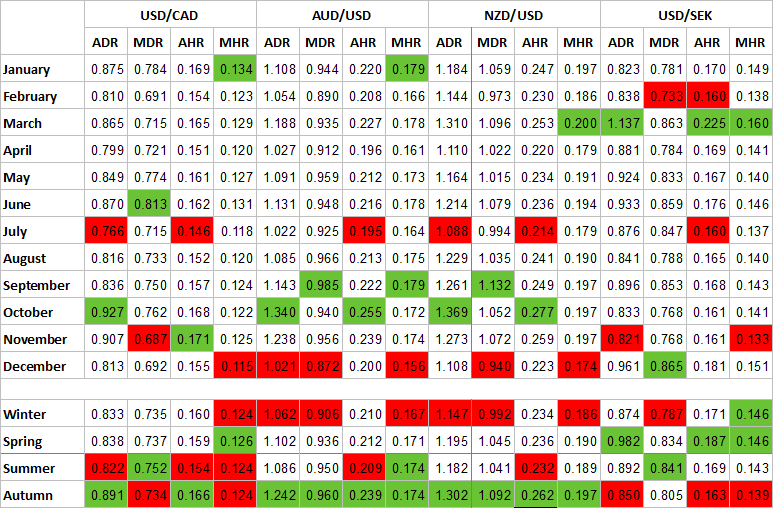
Percentage — CAD, AUD, NZD, SEK
USD/CAD, AUD/USD, NZD/USD, and USD/SEK also did not deviate far from the pip ranges. September and October seem to be the best month for most currency pairs and July and December look to be the worst, though there are some small deviations. Most notably, USD/SEK performs the best in March and December, while showing the worst performance in February, July, and November.
Winter remains the worst season to trade AUD/USD and NZD/USD. Spring is a good time for USD/SEK trading. Meanwhile, it looks like autumn is a favorable season for most pairs, except for USD/SEK, for which it is the worst.
Charts
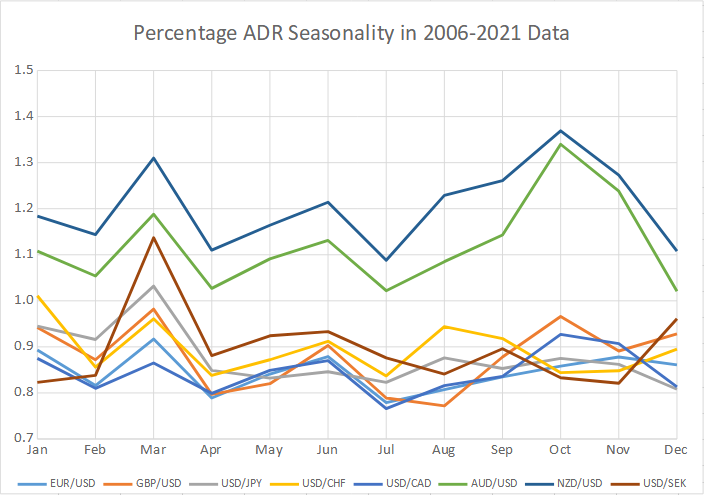
Switching from pips to percentage points allows drawing the comparison charts of trading ranges for all 8 currency pairs.
Percentage ADR seasonality
Pronounced peaks in March, June, and October along with overall wider percentage movement are evident in AUD/USD and NZD/USD here.
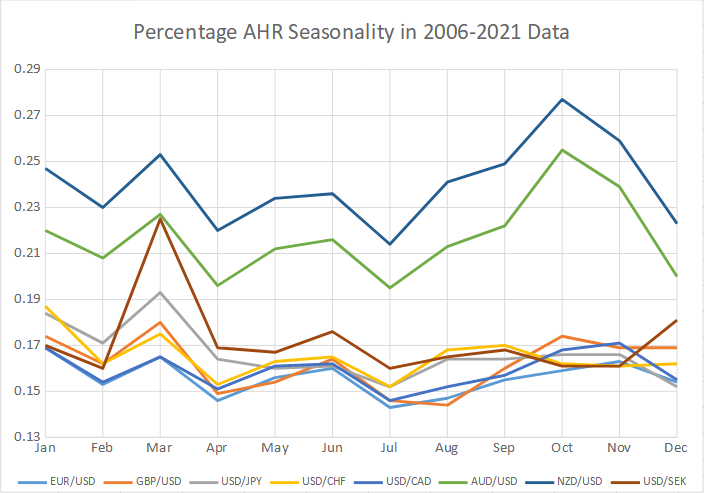
Percentage AHR seasonality
The difference between percentage changes of AUD/USD and NZD/USD compared with the remaining six pairs is also obvious when measuring hourly ranges. March and October peaks in AUD/USD and NZD/USD are an obvious highlight here. April and July troughs are rather apparent.
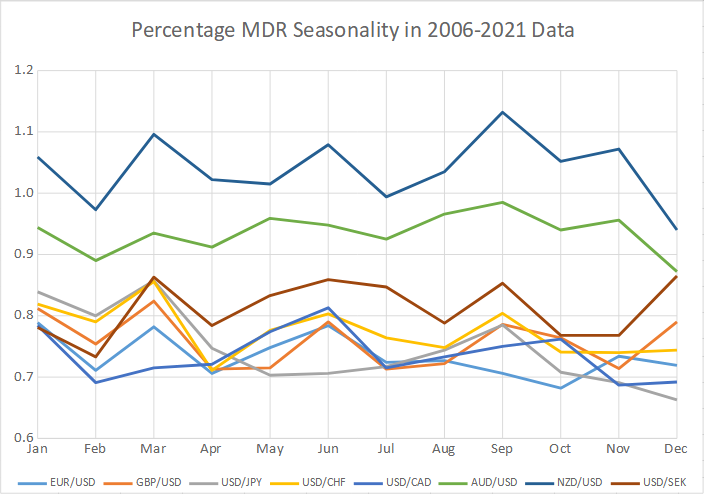
Percentage MDR seasonality
The peaks and bottoms of average daily ranges become less pronounced when switching to median ranges. Still, March, June, and September are clearly better than April, July, and December for most currency pairs.
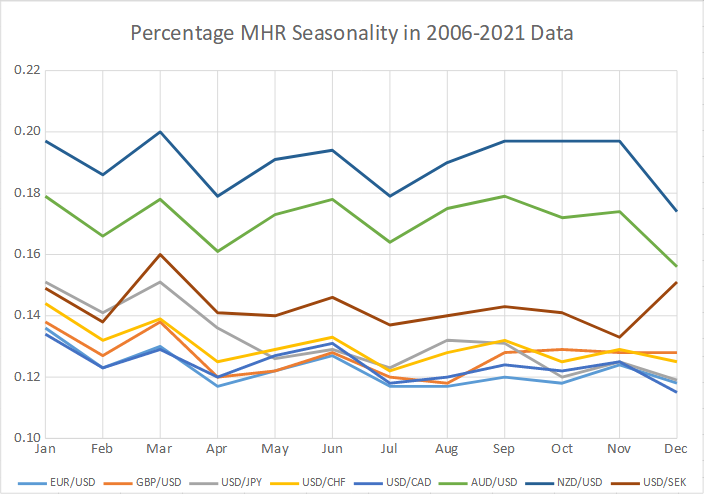
Percentage MHR seasonality
The plots of the hourly median ranges are the flattest of all analyzed so far. It is evidenced by a short Y-axis. Currency pairs demonstrate minimum ranges in April, July, and December. GBP/USD and USD/SEK demonstrate a notable difference, with GBP/USD bottoming out in August and moving almost flat afterward, while USD/SEK climbs in December instead of falling.
Free MT5 script
If you want to test the average and median ranges for other currency pairs or on different time periods, you can download the MetaTrader 5 scripts that were used to calculate all the ranges for this post. ADR-MDR.mq5 and ADR-MDR-Percentage.mq5 are very easy to use. By default, the script calculates ranges starting from 2006 but you can change the starting year in the appropriate input field of the script. The ending year is always the current year. It is important to remember that the script will not calculate months starting from the current one, doing the same for seasons, as to include only complete periods in its calculations.
Further research
The presented foreign exchange seasonality study is a modest attempt to see what can Forex traders expect from daily ranges of currency rates on different months and during different seasons. It uses 15 years of historical price data to show that some pairs tend to be more volatile during certain periods and calm during the others.
An interesting point of further research could be the reasons for the better performance of USD/SEK in December compared with other currency pairs.
Average and median ranges of weekly, 4-hour, and lower timeframes might also show some interesting results if recorded and compared for different months and seasons.
Additionally, switching from the ADR to ATR (Average True Range) can also yield interesting results, especially in the weekly timeframe, where gaps can be found in Forex rates.
If you want to share your opinion, observations, conclusions, or simply to ask questions regarding the seasonality in Forex, feel free to join a discussion on our forum.