Relative Strength Index
Relative strength index (RSI) is one of the top concepts in technical analysis. It was devised by Welles Wilder (who also discovered ATR and the parabolic stop-and-reverse system), but others have modified and adapted Wilder’s basic concept so that you will see various versions. Oddly enough, the top three adapters all have names that start with the letter C — Cardwell, Cutler, and Chande.
The core concept is an arithmetic manipulation of the ratio of up moves to down moves over a fixed period to convert the ratio to an oscillator that ranges between zero and 100. The RSI line measures momentum but has the added benefit of signaling the end of a move since we assume momentum fizzles ahead of price.
The formulation begins with relative strength, defined as the 14-period exponential moving average of the closes on days when the close was over the open divided by the 14-period exponential moving average of the closes on days when the close was below the open. Note that 14 periods was Wilder’s idea, but later adapters also recommend 9 and 25 periods, or you can backtest to find an optimum number for your currency and timeframe.
For example, say your currency closed higher on 9 of 14 days. You would average the daily gain on those 9 days but using 14 days as the divisor (not 9). You would average the daily loss on the 5 losing days, also dividing by 14. Divide the winnings days by the losing days and you have relative strength.
Once you have relative strength or RS, you convert it to an oscillator like this:
RSI is like the stochastic oscillator — values over a high number (Wilder recommended 70) are seen as representing an overbought condition and below a low number (Wilder recommended 30) are seen as oversold. Software will almost always show a horizontal line at these levels. You can use RSI to generate buy and sell signals at these levels.
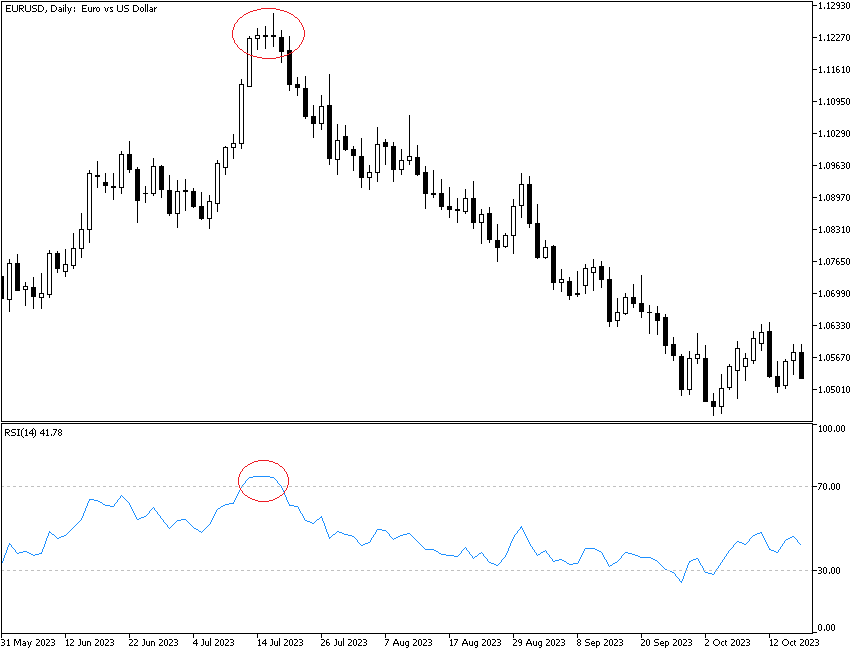
See the chart below for a basic RSI (bottom window). The circle shows the currency is overbought and likely to fall.
Another useful application of the RSI is to identify divergences, where the indicator starts pointing downward while the price is still pointing upward. Another kind of divergence is when the price is making a new high or low, but the RSI is not confirming. RSI may be higher, but not at the recent highest high. In both instances, the divergence is a warning of a pending directional change. The reliability of divergence-based trading decisions is remarkably high.
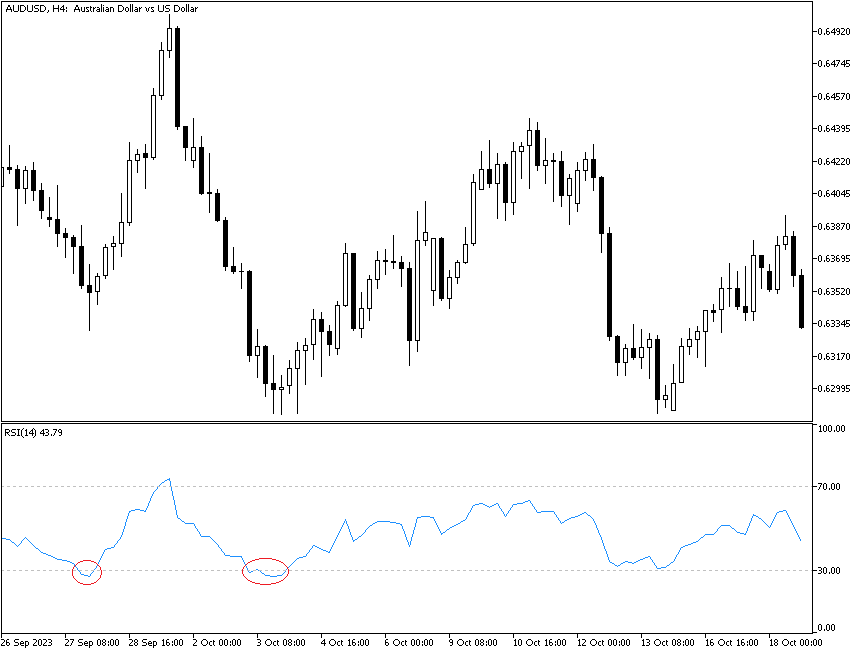
Another application is something Wilder called a “failure swing,” which identifies a pending reversal. A bullish failure swing occurs when RSI moves below 30 past the oversold level, bounces back above 30, but pulls back below 30. After that, it breaks above 30 and holds it. You can now expect a move to the other end of the spectrum. Note that you are looking only at the RSI indicator without reference to the underlying price bars.
A bearish failure swing is the mirror image. The RSI makes a peak above 70 to, say, 75, falls back below 70 to, say, 60, named the fail point, but peaks again — although it fails to match the earlier peak of 75. It is the failure to match the first peak that marks it as a likely failure swing, and you will want to sell when the price falls under 70. Many analysts consider 60 and 40 to be good candidates for the failure swing. See the next chart for a bullish failure swing.
You can also use RSI as a confirming indicator for other indicators, especially moving average crossovers. Finally, you can often see chart patterns on the RSI, such as double tops, head-and-shoulders, etc. You can even draw support and resistance lines on the indicator, which is not as strange as it seems — after all, the indicator is just the same price data as on a regular chart, just rearranged a little bit.
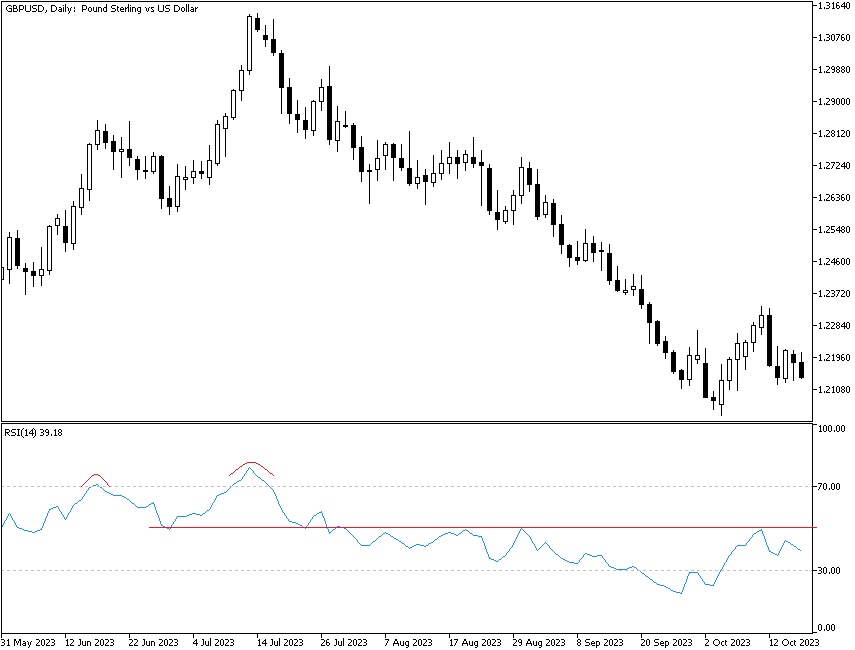
The next chart shows a different currency that is moving from overbought, with a double top, to oversold. Notice that the sharp drop near the end of the price series comes after the double top neckline is broken — the classic effect. Note that this chart does not illustrate a failure swing because the second peak exceeds the first peak. A failure swing has a second foray above the overbought line that does not match the first peak.
Be careful to maintain the distinction between the relative strength index on a single security and “relative strength,” which is a ratio in which you divide the prices of two securities (such as the relative strength of silver vs. gold). Logically, we do not use relative strength in Forex because we have cross-rates for that function.