Intermarket Correlations
Without getting too technical, a correlation between two securities is perfect when a statistical calculation named the correlation coefficient is +1. A perfect negative correlation is -1, meaning the two securities move in opposite directions. A correlation coefficient of zero means a move in one security has no consistent counterpart in the other one.
In practice, nothing in finance has a perfect correlation with something else because no two securities are identical, but we use high correlation coefficients between two securities to predict that a change in one will be accompanied by a similar change in the other security, either in sync or in opposition. Since all financial securities respond to fresh economic data and other developments, the correlation coefficient is a fast and cheap way to avoid any time-consuming analysis. Correlation coefficients allow the analyst and the trader to jump to conclusions.
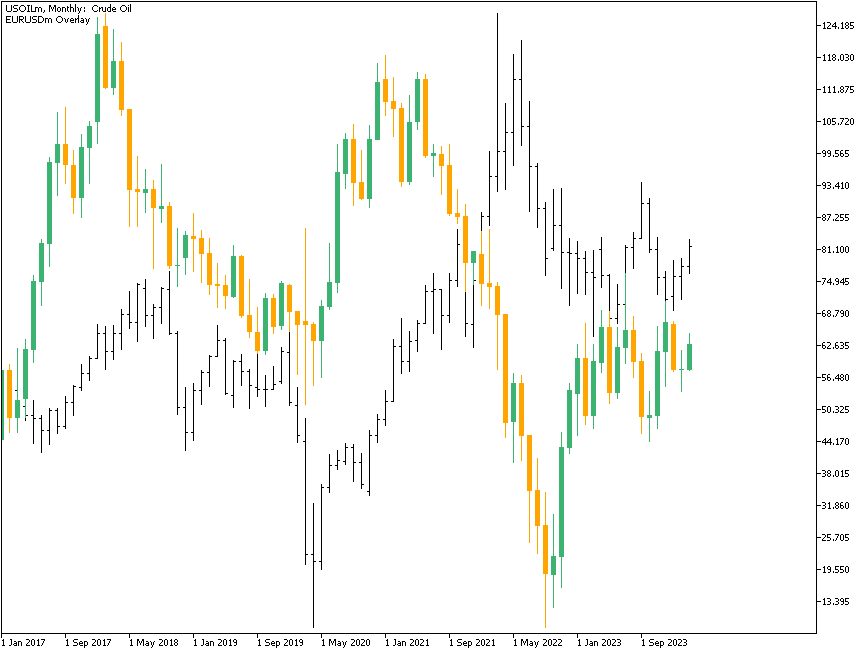
More bunk is written about intermarket correlations than just about anything else in the world of Forex commentary. The most egregious case is the purported correlation of the EUR/USD with the price of oil. This is not to say they are not correlated. The correlation coefficient for WTI oil and the euro is, indeed, fairly high, at least much of the time and over long periods. The correlation is visually obvious:
The problem lies not in the correlation but in the mindless chatter about it. When oil analysts cannot explain a move in the price of oil, they say “oil is up because the dollar is down.” When Forex analysts cannot explain a particular rise in the dollar, they say “The dollar is up because oil is down.” This kind of circular reasoning is maddening, especially because it neglects the real and lasting reasons that prices change in oil – supply and demand factors – and the real reasons that prices change in the EUR/USD, like central bank policies. The most awful aspect of intermarket correlation chatter is the assumption that correlation is causation. “Oil rose because the dollar fell.”
There probably are occasions when this is true — that Forex traders are looking at oil and only oil — but the real reason for the high correlation coefficient is that oil and the dollar are responding to multiple factors to the same extent, just in the opposite way. A good case is the onset of the Russian invasion of Ukraine in February 2022. In the chart above, you may notice that the correlation has been, in fact, negative since the beginning of 2022.
You can see many occasions when oil and the euro move inversely. See the next chart, showing the same data on a daily basis. The blue line is the linear regression of oil prices, and the red line is the linear regression of EUR/USD. They both denote a true trend. Net-net over this period, the correlation coefficient was below zero, even though there have been periods of simultaneous movements in both assets.
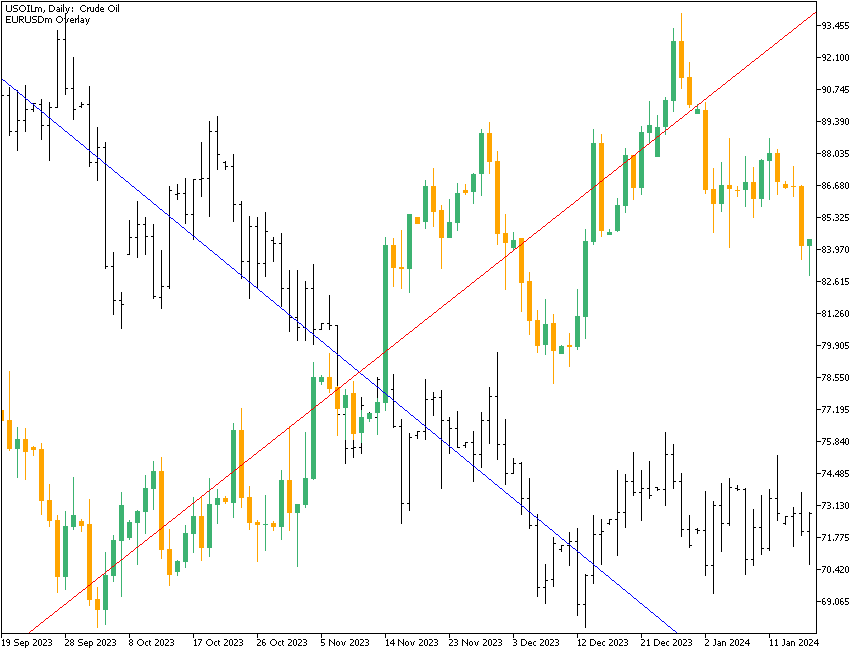
The lesson here is that a high correlation over a long period is not useful when trading in a short timeframe. The relevant correlation coefficient for a Forex trader in the euro would be the 15-minute, the one-hour, or the daily timeframes.
Then there is talk of “decoupling”, now that the US has become a major oil and gas producer in its own right, reducing dependence on foreign oil and topping other major oil producers such as Russia and Saudi Arabia. As the US oil production numbers climb with every passing month, does not the rationale for the correlation go away? Well, maybe. The main benefit of energy self-sufficiency is an improvement in the US trade balance, not really an immediate Forex driver these days, although the addition of 1-2% in GDP will get the notice of Forex traders. Energy prices are not included in the core CPI, so we cannot expect a change there. So you have to ask, what decoupling?
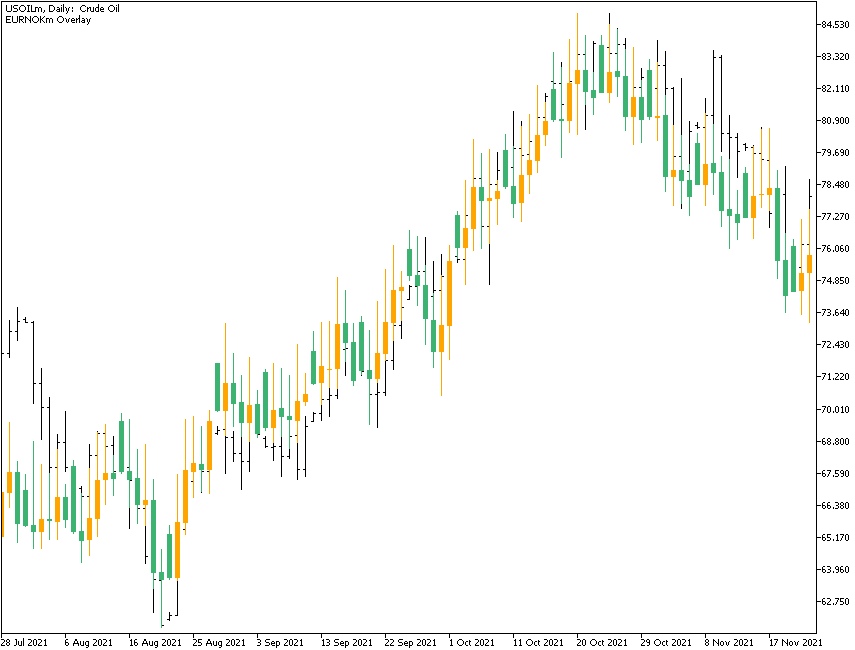
We can find cases where intermarket correlation and causation are clear. One is the period of rising oil prices in August-October 2021. As oil prices rose, the Norwegian currency tracked the rally. You can see it on the chart below. The oil is shown in black, and the NOK/EUR rate is shown in green and orange candles. The implication of the oil/NOK correlation is that crude oil comprises a significant portion of Norwegian exports. Higher oil prices mean a higher inflow of foreign currency into the country and, thus, better exchange rates.
This observation opens a can of worms. We need to be careful not to attribute the same kind of relationship to the major currencies and their export goods, as seen in Norway's case. The Norwegian krone is not one of the major currencies and the country's economy is not among the world's largest, and we do not get clear one-to-one movements like this in bigger markets. In the USA, for example, the correlation coefficient between oil and US equities from 1973 on a monthly basis is -0.003. When oil goes up, US equities go down, but by such a tiny amount that, for all practical purposes, we should consider it zero. This is a case in which the correlation may be high for short periods but not for long periods, exactly the opposite of the oil and euro case.
Another long-term relationship is the US trade-weighted dollar index against the S&P 500. According to the daily data from March 2014, the correlation coefficient is 0.545. The implication is that a strong dollar is good for US equities, presumably because it makes importing raw materials cheaper — about 55% of the time, US stocks rise in tandem with a rising dollar. Also, both equities and the dollar tend to rise when the economy demonstrates faster-than-average growth.
Verifying Data
If you are a data-hound, you can easily perform correlation exercises using Excel or similar software. However, you should also take the next step, which is to obtain the r-squared value of your correlation coefficient. Creating the r-squared value (by squaring the number) gives you the degree of causation you can attribute to the first variable’s effort on the second one. In the case of the S&P and the dollar index, the r-square value is 0.0086, meaning the movement in US equities cannot be attributed to movements in the dollar. This is not to say that some movements on some days might be directly related. For example, since the beginning of 2024, both the dollar and the S&P 500 have been rising nearly in sync due to the outlook for the Federal Reserve interest rate policy. This runs directly counter to the idea that the dollar and S&P are inversely correlated since they are clearly rising together during this period, but the incident points out that context always counts.
You can play with correlations until the cows come home, and many people do. We see articles all the time in which the writer has found some splendid and hitherto unknown relationship between, say, soybeans and aluminum, or something equally freaky (and almost certainly not valid).
Having given all these warnings about the abuses that correlation is subject to, it remains somewhat useful to have a grasp of what the Forex market believes about correlations, even if the market is wrong. The Forex market tends to believe if oil is up, the dollar should be down. It believes the euro is positively correlated with the S&P 500. These instances of market lore are very hard to kill off, no matter how much data you throw at them.