Andrews' Pitchfork — A Trend Trading Indicator
Contents
- What is Andrews' Pitchfork
- How Andrews' Pitchfork looks and how it is constructed
- Parts of Andrews' Pitchfork: how they are named and what they mean
- Andrews' Pitchfork variations
- How to trade Andrews' Pitchfork
- Challenges with using Andrews' Pitchfork
- Andrews' Pitchfork in charting platforms: how to construct it and how it looks
There are dozens of different technical indicators Forex traders can use, including various shapes and objects drawn over charts. Some of them are widely known and extensively used — e.g., all sorts of channels and triangles. But there are more exotic ones, less often used, but not necessarily less useful. This guide describes one of them — Andrews' Pitchfork.
What is Andrews' Pitchfork
Andrews' Pitchfork is a technical indicator developed by Dr. Alan Andrews — a statistician and trader. He reportedly used it to great effect during the Great Depression, though he started to teach it to other people only in the 1960s.
Here are some other names for Andrews' Pitchfork you may encounter in various articles and videos: Median Line Studies, Median Line Method, Median Lines, Andrews' Median Lines.
Andrews' Pitchfork is essentially a tool for drawing price channels. It helps to identify medium- and
Andrews' Pitchfork works well in a strong uptrend or downtrend but is not particularly useful in sideways trading markets. That said, some of the variations of Andrews' Pitchfork are better suited for sideways moving prices.
Being an indicator that identifies general trends, Andrews' Pitchfork works best in long- and
In the foreign exchange market, Andrews' Pitchfork is considered to be more useful with popular currency pairs due to their tendency to trend.
How Andrews' Pitchfork looks and how it is constructed
Andrews' Pitchfork consists of three parallel lines, with the upper and lower lines being equidistant from the middle line. The middle line is longer than the upper and lower lines. Usually, an additional line is drawn between the beginning points of the upper and lower lines, but it is not strictly necessary and is sometimes omitted. The indicator looks, quite appropriately, like a farmer's pitchfork, hence the name.

To draw the indicator, you need to identify three major highs and lows (pivot points). Then draw a line from the first pivot point through the point exactly in the middle of the second and the third point. Afterward, draw a parallel line starting at the second pivot point and another line parallel to the middle one from the third point. Thus, you get the three "prongs" of the pitchfork. For an uptrend, the pitchfork is constructed from a low to a high and then another low, in that order. For a downtrend, the pitchfork is constructed from a high to a low to another high, in that order.
Parts of Andrews' Pitchfork: how they are named and what they mean
Andrew's Pitchfork has many parts, and to use the indicator, traders should understand what they are.
Here is the picture with all the parts of Andrews' Pitchfork indicated:

Next, let's see what the specific parts are: how they are named and what they mean.
Pivot points
The key highs/peaks and lows/troughs are called turning points, pivot points, or simply pivots.
It is incredibly important to properly identify pivot points as they define the resulting look of the pitchfork. You may need to tweak your pivots a bit to better catch the trend in a channel.
Median line
The center line is called a median line.
According to Andrews, prices tend to gravitate towards this line 80% of the time. After reaching the line, prices are likely to either reverse their movement or gap through the median line.
Traders often consider the median line to be a support/resistance level within the general trend, which is weaker than the support and resistance levels shown by the upper and lower lines respectively but still significant. But some experts argue against such interpretation, saying that in a strong trend and within a properly constructed pitchfork prices should be moving around the median line, swinging back and forth above and below the line with no problem.
In any case, it is a common consensus that if prices hug the median line, moving largely close to it, that means the trend is clear and strong. However, it is also a common theory that prices will move largely above the median line in a particularly strong uptrend and below the median line in a particularly strong downtrend.
Midpoint
The point midway between the second and the third pivot points, through which the median line is drawn, is called the central point or midpoint.
Handle
The part of the median line that lies between the first pivot point and the midpoint is called the handle.
Parallel lines
The two parallel equidistant lines that lie above and below the median line have many names. Among them are support and resistance lines, higher and lower trend lines, parallel/channel lines, upper median line and lower median line.
The latter term (upper and lower median lines) is very often used, but some experts argue that it does not make sense. By definition, a "median" means that it lies in the middle between two points, values, etc. That definitely applies to the center line, which is situated midway between the two pivot points and the two parallel lines, but not really applicable to the upper and lower parallel lines.
According to Andrews, prices will reach the parallel lines only 20% of the time.
The parallel lines are usually considered to be the most important part of Andrews' Pitchfork. A common interpretation of the lines is that the upper line should provide strong resistance and the lower line provides strong support, at least if the pitchfork is constructed properly. In fact, it is usually considered to be a good idea to wait for prices to bounce at least once from one of the lines to confirm the pitchfork.
As it is usual for support/resistance levels, in case of an upward breakout the former resistance level becomes support while in case of a downside breakout the former support level becomes resistance.
Warning lines
While the median line and the upper and lower parallel lines are the main components that form Andrews' Pitchfork and thus are always present, sometimes traders draw additional lines in parallel to the median line. Such lines are called warning lines.
One type of such lines is drawn inside of the pitchfork and is called quartile lines. Such lines are drawn on both sides of the median line in the middle between the median line and the parallel lines. Quartile lines are used to catch a
Warning lines are also often used to catch a breakout. In that case, they are drawn outside of the pitchfork. Such lines are drawn either at the half of the distance between the median line and the parallel line (basically a quartile line mirrored to the other side of a parallel line) or at the distance equal to the width between the median line and the parallel line.
Outside warning lines provide support and resistance in case of a breakout. It is expected that the price will likely bounce from a warning line back inside the pitchfork. If that is the case, then it indicates a false breakout. But if the price moves beyond a warning line, then it will reverse its role: the previous support becomes resistance, and the previous resistance becomes support. If the price successfully tests the new support/resistance level by bouncing from it beyond the previous peak or trough, it indicates that the previous trend has ended, and it is time to identify a new trend.
Schiff line
Another way to identify an end to the trend is the line called Schiff line or trigger line. It is drawn between the first and the third pivot point and serves basically the same purpose as the warning lines. A Schiff line provides support or resistance, and if the price breaks beyond it, that signals about an end of the trend.
Andrews' Pitchfork variations
While the common Andrews' Pitchfork is by far the most often used version of the indicator, it has other variations that can be useful in different situations. The general rule of thumb is to use the version of the pitchfork that encapsulates the trend the best.
You will learn next about different variations of Andrews's Pitchfork and explain how they are constructed. To better understand the difference between the variations you will see the comparison of their look to the basic version of Andrews' Pitchfork.
Here is the common version of Andrews' Pitchfork:

The following variations will be constructed using the same pivot points and are drawn by just changing the type of pitchfork used.
Schiff Pitchfork
Schiff Pitchfork (named after one of Andrews' students) moves the start point of the handle line halfway towards the third pivot in price (y-axis). This version is considered to be better than the regular Andrews' Pitchfork in shallower up- or downtrends as its angle is not as steep compared to the regular pitchfork. Sometimes, it can look very close to a parallel channel and work in sideways markets.
Here is how Schiff Pitchfork looks:
Modified Schiff Pitchfork
Modified Schiff Pitchfork is drawn similar to a regular Schiff Pitchfork but on top of moving the handle start point 50% towards the third pivot on the y-axis, it also moves the handle 50% forward (towards the third pivot) in time (x-axis).
The resulting pitchfork has a less steep angle than the regular Andrews' Pitchfork, but a steeper angle compared with the regular Schiff Pitchfork.
Here is how Modified Schiff Pitchfork looks:
Inside Pitchfork
Inside Pitchfork differs the most from other variations as the method for drawing is quite distinct. Sometimes, this version of the pitchfork can point in the opposite direction compared to the other versions.
To draw the Inside Pitchfork, you need to draw a line from the point in the middle between the first and the second pivot through the third pivot. The second line is drawn from the second pivot in parallel to the first line. Those two lines will be the outer trend lines (upper and lower parallel lines). Then the median line is drawn midway between the two outer trend lines.
Here is how Inside Pitchfork looks:

How to trade Andrews' Pitchfork
The main rule of using Andrews' Pitchfork is the same as for the channel: in an uptrend, the upper channel line might serve as resistance, while in a downtrend, the lower line might be used as a potential support level. The handle (median line) shows the strength of the trend: in strong uptrend conditions, price tends to be above the median line while in a strong downtrend, below.
The most basic strategy involving Andrews' Pitchfork is to buy when prices bounce from the lower trend line in an uptrend and sell when prices retreat from the upper trend line in a downtrend. Experts often advise taking
Some analysts also use the Schiff line in case of a breakout. If in an uptrend, the price breaks below the lower trend line and then below the Schiff line, traders should wait for the price to test the Schiff line. If the price bounce, creating a low, but retreat from the Schiff line below the previous low, then traders can enter a short position. A similar strategy works in the opposite situation: if in a downtrend the price breaks from the pitchfork to the upside above the Schiff line, traders should wait for the price to create a new high and retreat toward the Schiff line. If the price bounces from it and rise above the previous high, then it is a signal to enter a long position.
Warning lines can also be used in a similar manner to the Schiff line.
Challenges with using Andrews' Pitchfork
The biggest challenge for a trader using Andrews' Pitchfork is to correctly set up the pivot points so the resulting pitchfork properly encapsulates the trend. In a properly constructed pitchfork, the price should bounce between the upper and lower trend lines, preferably avoiding breaks outside of the trend channel. Traders should adjust their pivot points to find a channel that is better at catching the market moves. Traders can also try using different variations of Andrews' Pitchfork to find the one that works best in the current market conditions.
Identifying whether a breakout is just a false breakout or a genuine change in the trend can be a challenge. Using the Schiff line and warning lines can help with that.
Some traders prefer using several pitchforks at the same time to better catch shifts in the trend and to find strong support and resistance levels. Using an excessive number of pitchforks, though, can create confusion instead of helping.
As any technical indicator, Andrews' Pitchfork generally should not be used alone. It is better to combine Andrews' Pitchfork with signals from other technical indicators before making a trade decision.
Andrews' Pitchfork in charting platforms: how to construct it and how it looks
Even though Andrews' Pitchfork is a less popular technical indicator, almost all major platforms have it by default. Yet not all of them have all the variations of the indicator.
The following chapters explain how to draw Andrews' Pitchfork in major trading platforms, show how it looks in them, and list the available variants at each platform.
MetaTrader 4
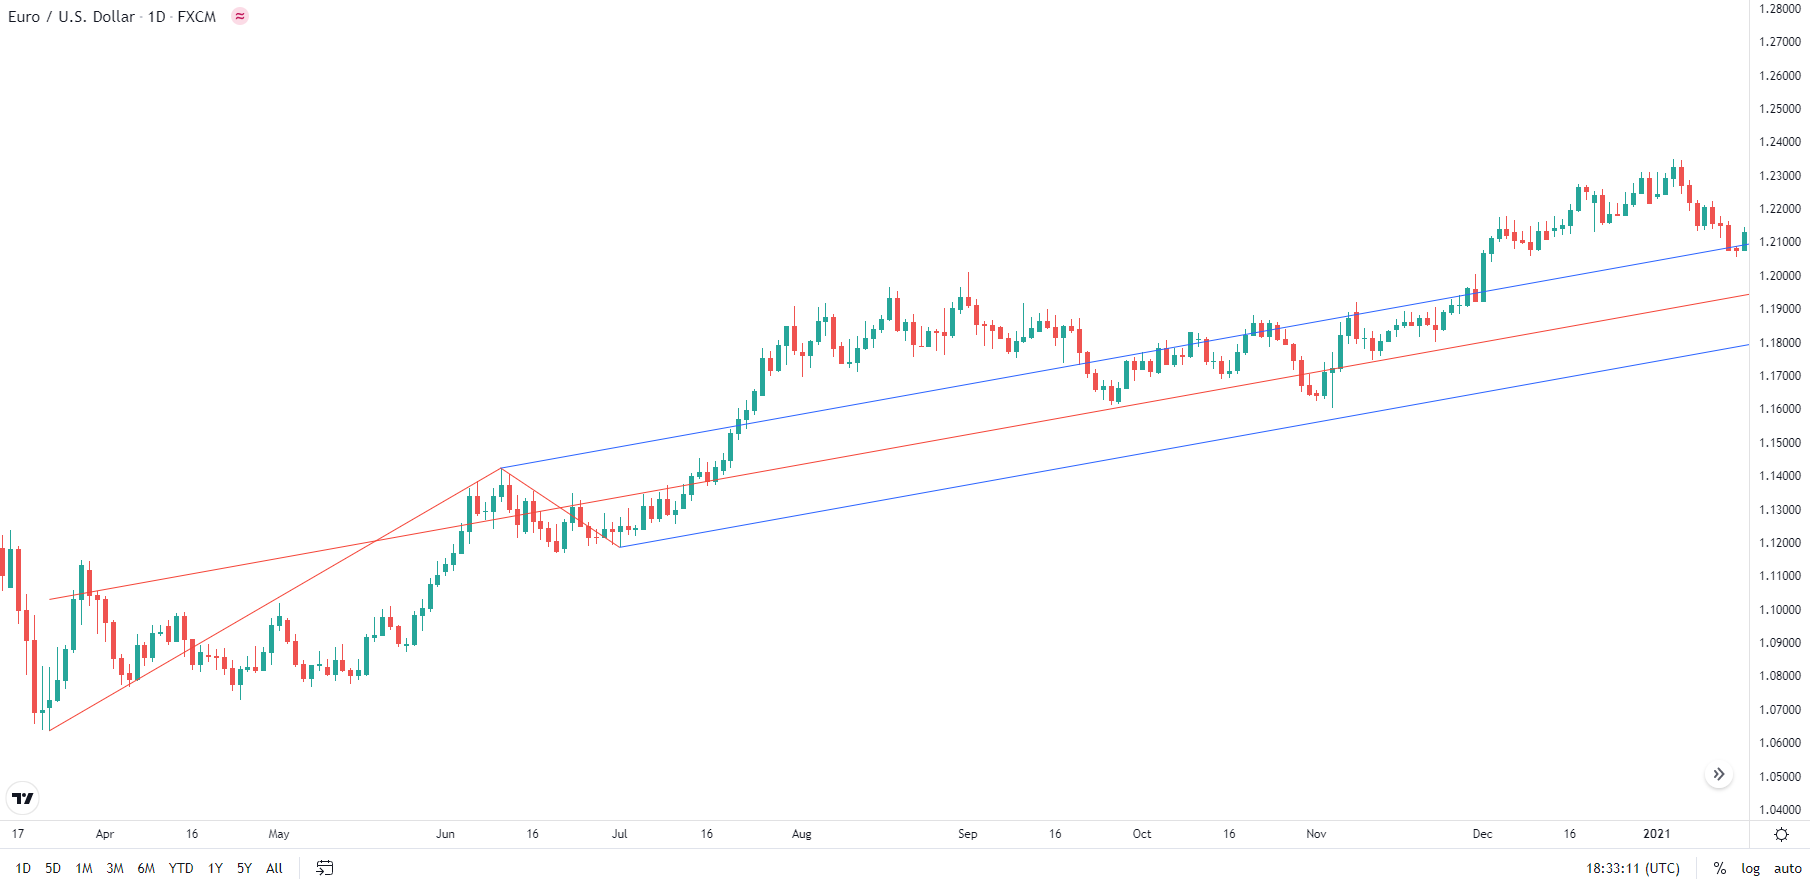
It is very easy to draw Andrews' Pitchfork in MetaTrader 4. To do it, you need to simply choose from the main menu Insert->Andrews' Pitchfork. Then you need just to choose the three pivot points, and the platform will draw the three lines (the median line and the two outer parallel lines).
Here is how the resulting Andrews' Pitchfork looks in the MetaTrader 4 platform:
Unfortunately, MetaTrader 4 has very few customization options for Andrews' Pitchfork. The platform also does not have any alternative versions of the pitchfork.
MetaTrader 5
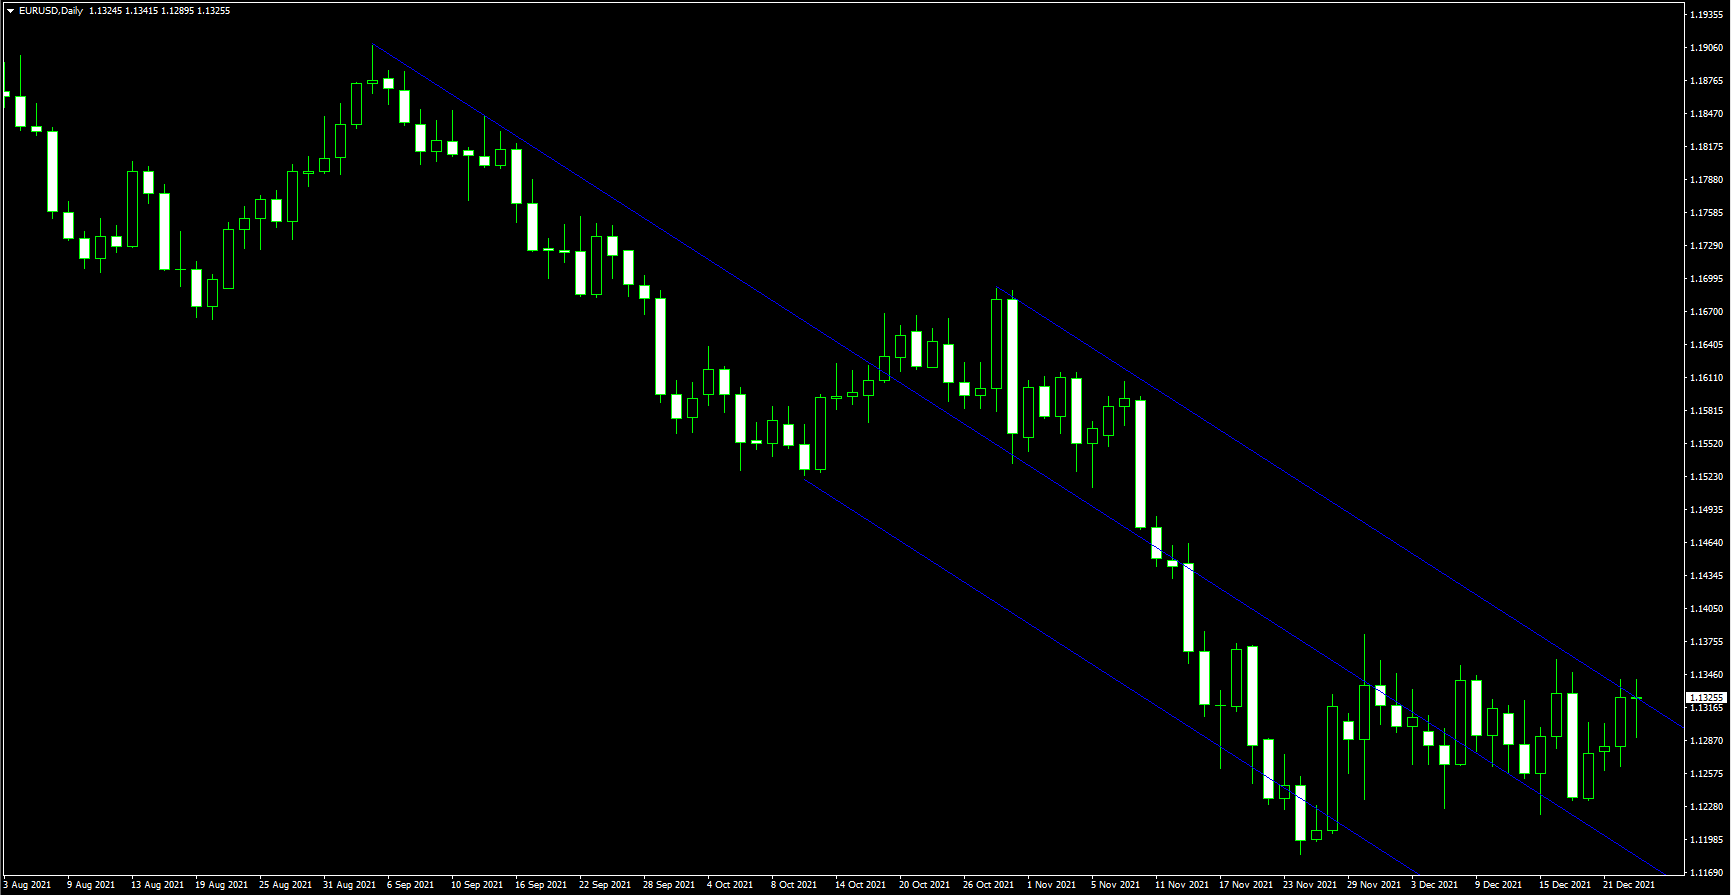
Drawing Andrews' Pitchfork in MetaTrader 5 is a bit more complicated. To do so, you need to choose from the main menu Insert->Objects->Channels->Andrews' Pitchfork. Then you need to choose the first pivot point and the second pivot point. Afterward, you have to click on the second pivot and drag to the third pivot to get the channel. By default, the platform also draws warning lines. Interestingly, besides the line drawn at 100% of the distance between the median line and the outer trend lines, the platform also uses Fibonacci ratios to draw additional lines.
Here is how the resulting Andrews's Pitchfork looks in the MetaTrader 5 platform:

Compared to MetaTrader 4, MetaTrader 5 adds options to adjust warning lines. Otherwise, it has the same options as MetaTrader 4 and also does not have any alternative types of Andrews' Pitchfork.
TradingView
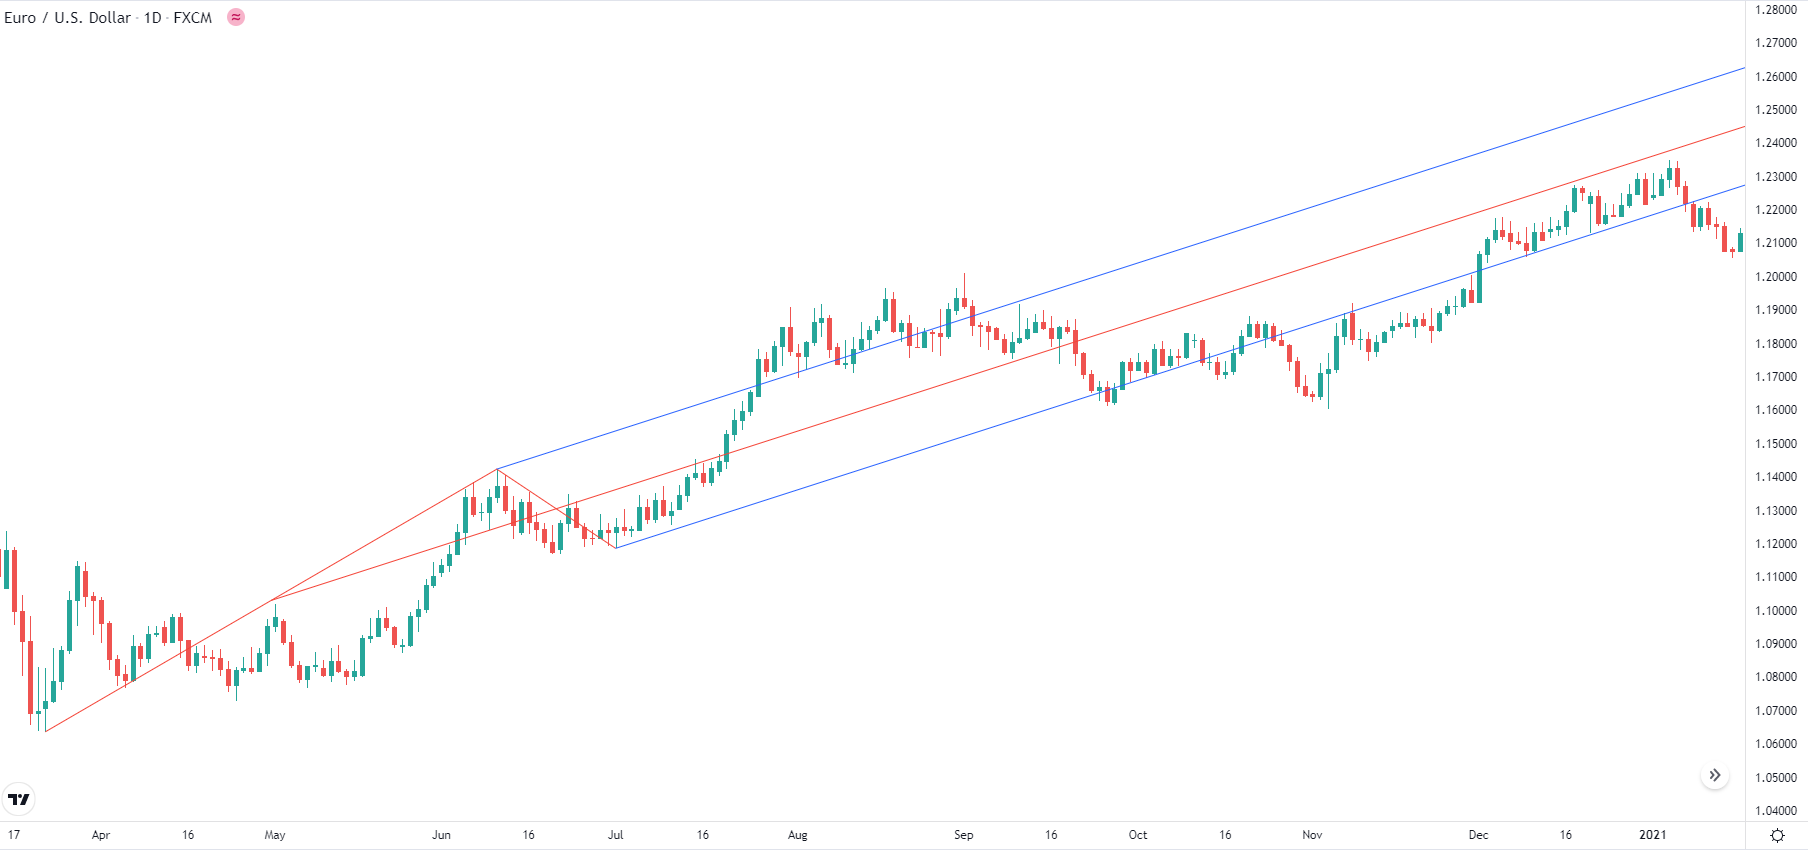
TradingView is arguably the best platform for drawing Andrews' Pitchfork. To do so, you need to choose in the left-hand menu Gann and Fibonacci Tools->Pitchfork. Instead of the basic Pitchfork, you can also choose any of the variations right from the menu. Then you click on the three pivot points in consecutive order. To place the pivot points more accurately, you can choose the Magnet Mode on the left-hand menu. By default, the platform draws the pitchfork with quartile lines. It also colors the background.
Here is how the resulting Andrews' Pitchfork looks in the TradingView platform:

The platform has a wide range of options for adjusting the pitchfork as well as the ability to choose the type of pitchfork on the fly. TradingView has all four types of Andrews' Pitchfork: basic, Schiff, Modified Schiff, Inside Pitchfork.
NinjaTrader
You can draw Andrews' Pitchfork in NinjaTrader by choosing Drawing Tools->Andrews' Pitchfork from the menu either on the top of the platform or the one that opens after
Here is how the resulting Andrews' Pitchfork looks in the NinjaTrader platform:
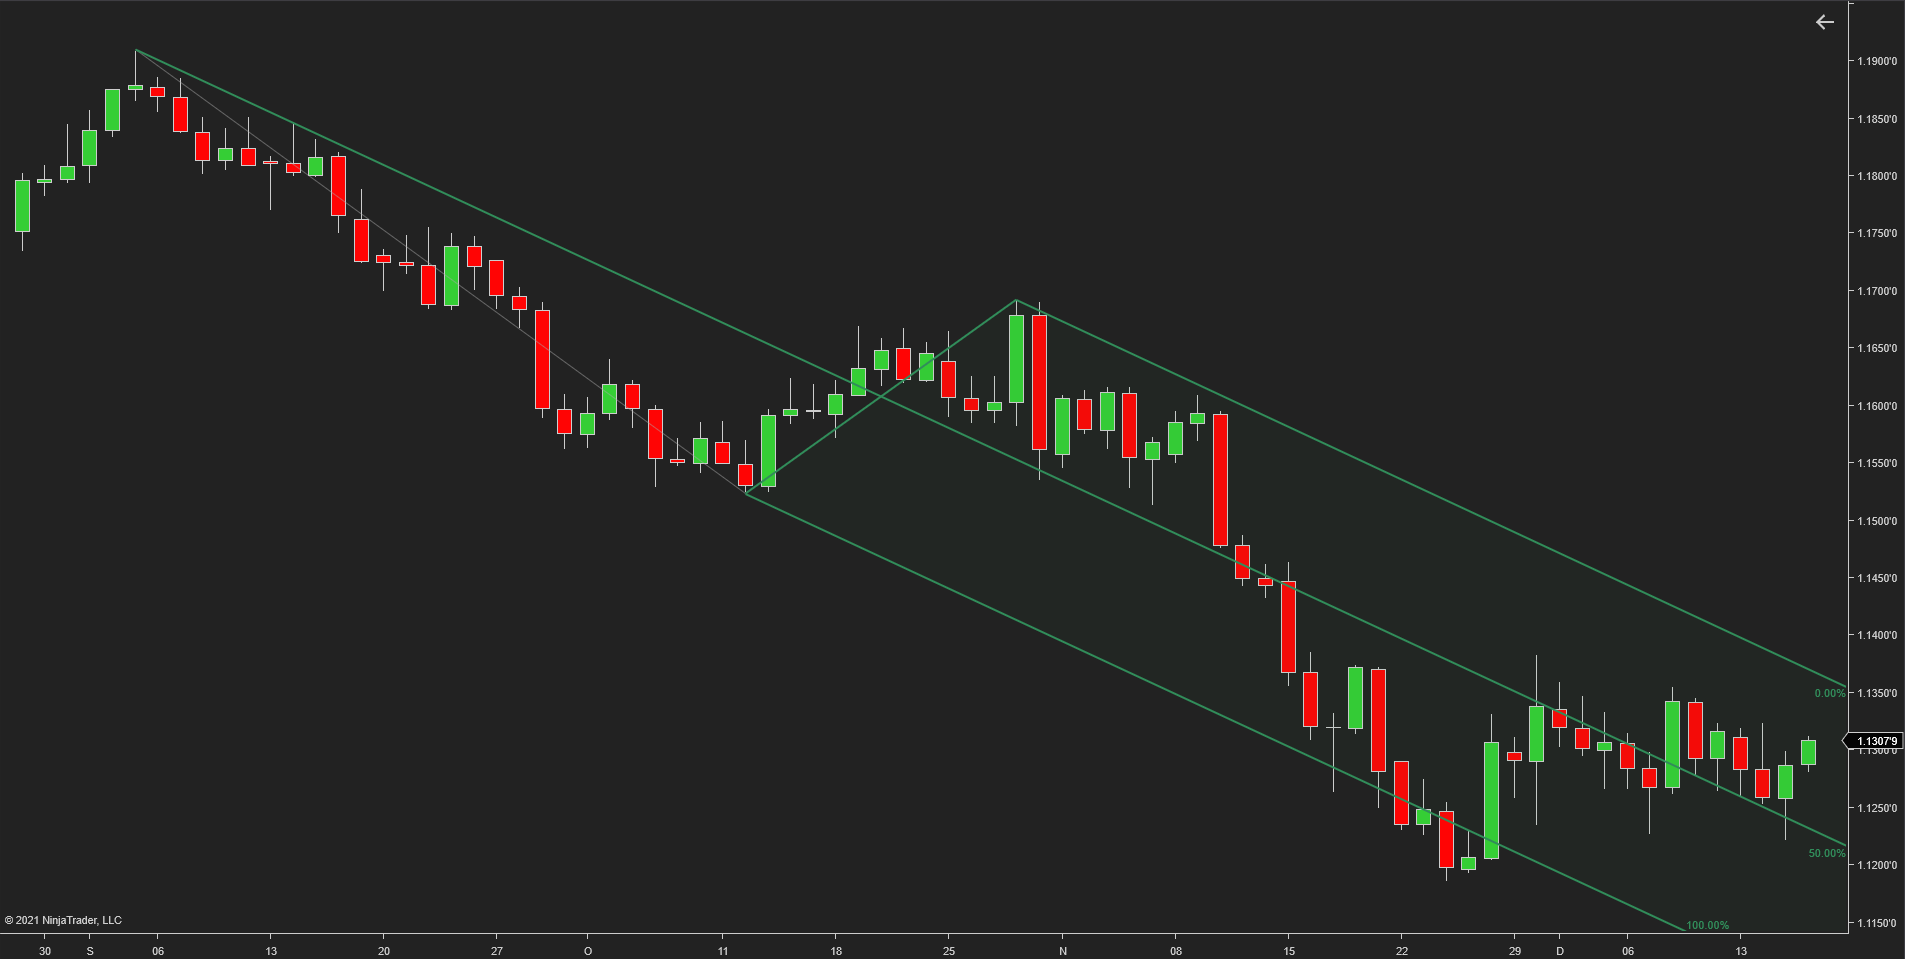
NinjaTrader has a relatively limited number of options to adjust Andrews' Pitchfork. As for variations of the pitchfork besides basic Andrews' Pitchfork, NinjaTrader has Schiff and Modified Schiff pitchforks but does not have the Inside Pitchfork.
If you want to share your opinion, observations, conclusions, or simply to ask questions regarding Andrews' Pitchfork in Forex trading, feel free to join a discussion on our forum.
If you want to get news of the most recent updates to our guides or anything else related to Forex trading, you can subscribe to our monthly newsletter.