Forex Candlestick Patterns Cheat Sheet
The topic of the Japanese candlestick patterns in currency trading is rather controversial because not all of them apply to the spot foreign exchange market. With almost no gaps between the candles and no definite daily close/open levels, traditional candlestick patterns are somewhat less applicable in Forex. The cheat sheet below summarizes candlestick patterns as they present themselves in FX trading. It omits some of the famous ones, which work well in equities but do not do well in currencies, and provides modifications of other patterns to fit the currency trading perspective.
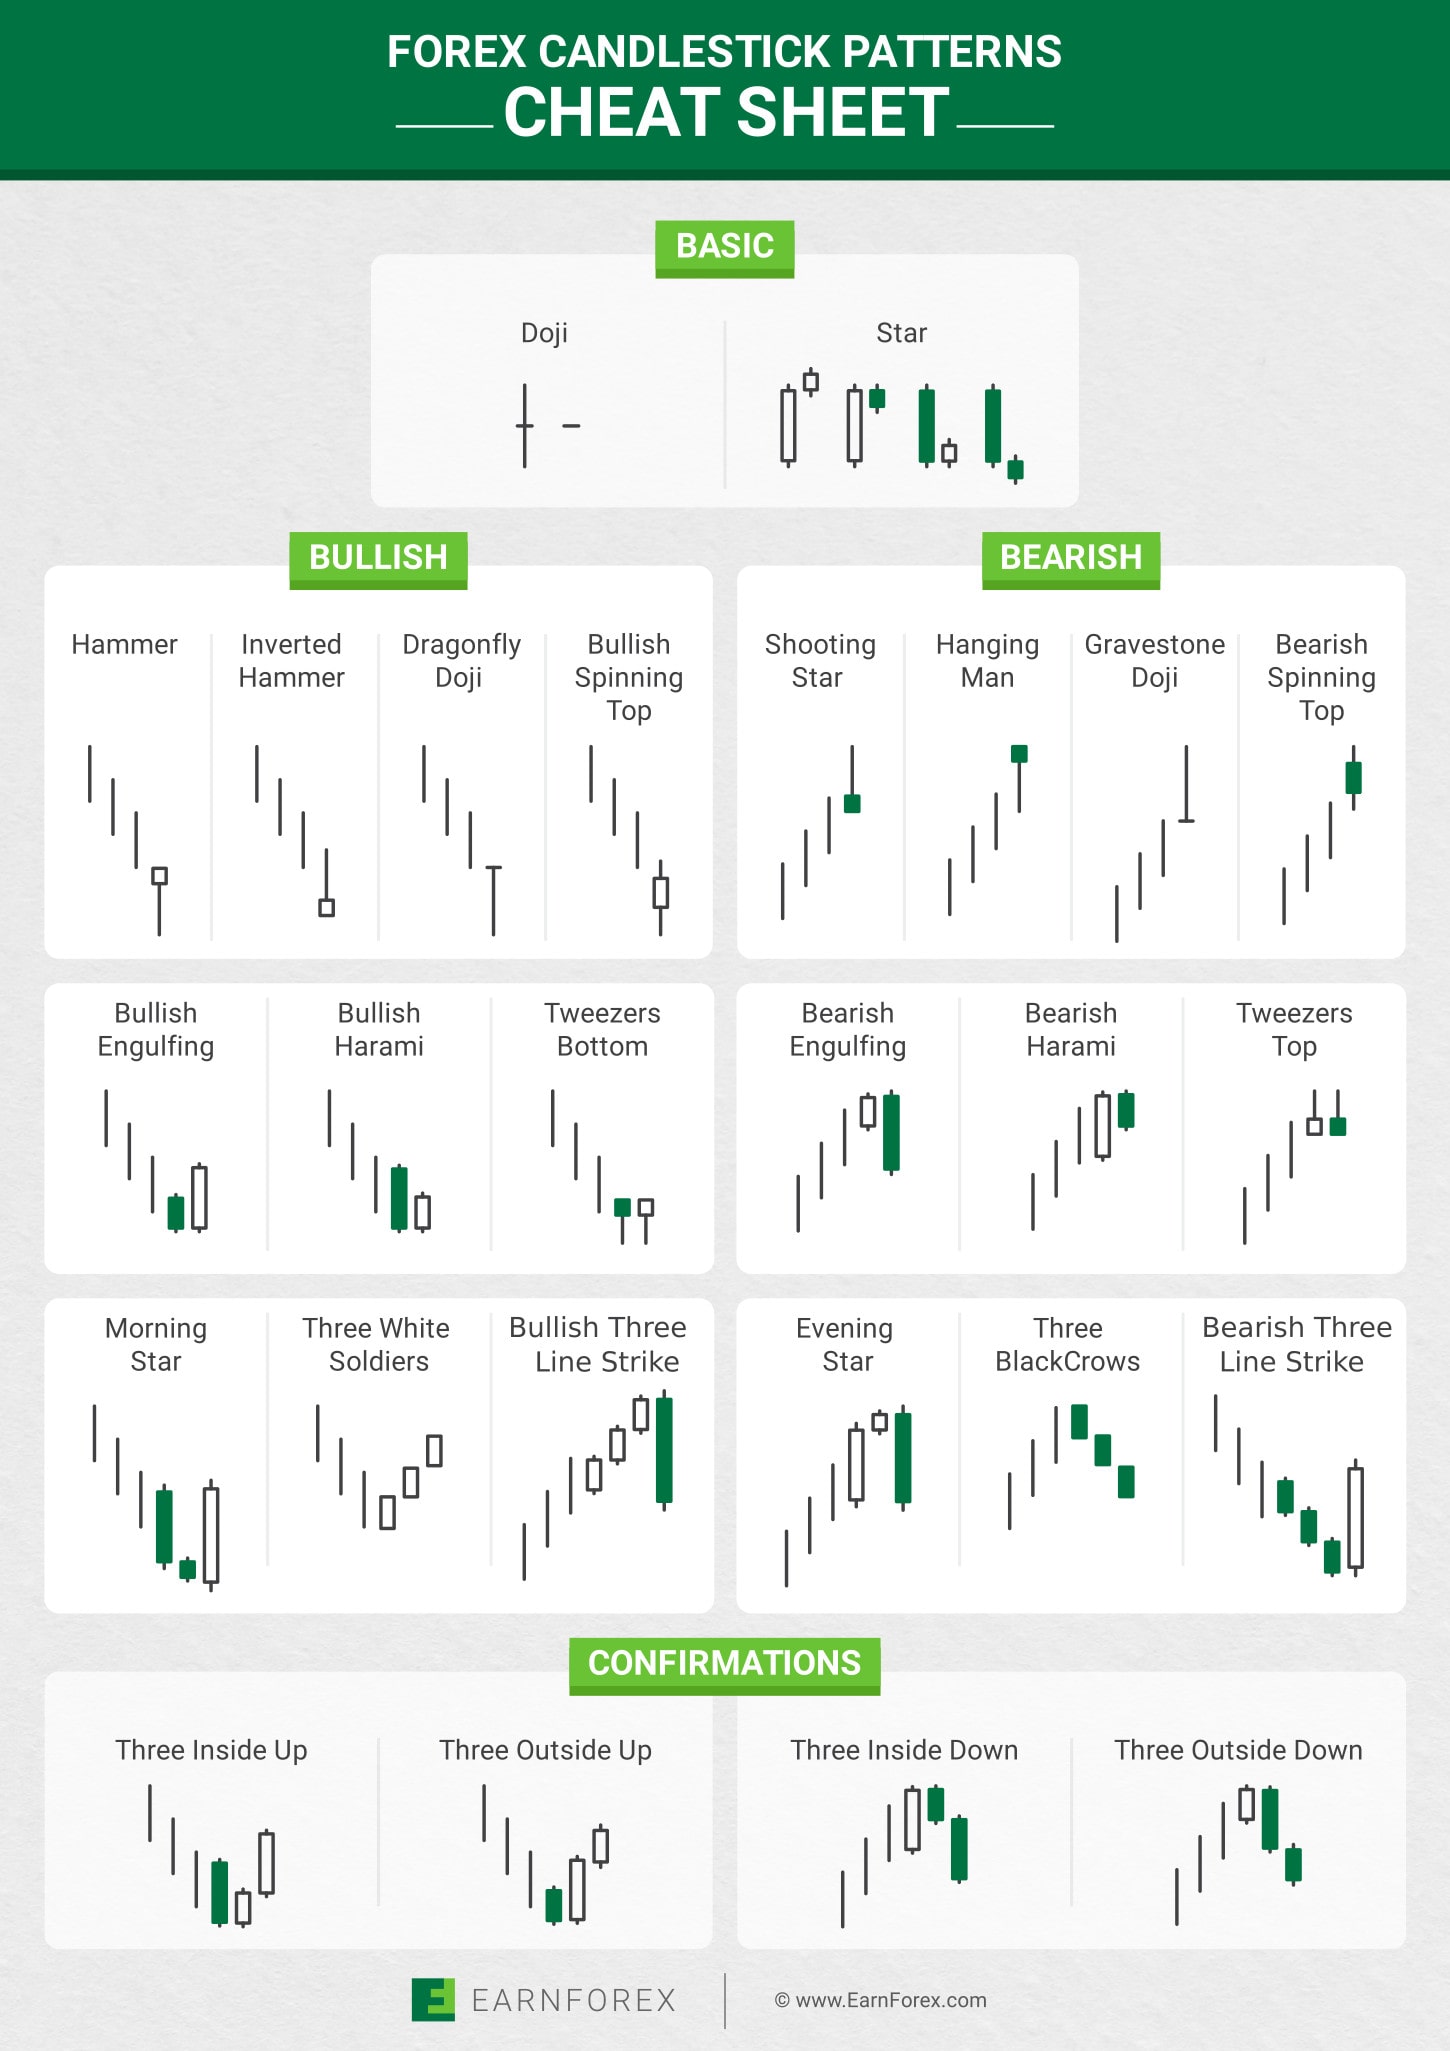
The cheat sheet below provides a quick reference for the following 26 candle patterns:
Basic Doji, Basic Star, Hammer, Inverted Hammer, Dragonfly Doji, Bullish Spinning Top, Shooting Star, Hanging Man, Gravestone Doji, Bearish Spinning Top, Bullish Engulfing, Bullish Harami, Tweezers Bottom, Bearish Engulfing, Bearish Harami, Tweezers Top, Morning Star, Three White Soldiers, Bullish Three Line Strike, Evening Star, Three Black Crows, Bearish Three Line Strike, Three Inside Up, Thee Outside Up, Three Inside Down, Three Outside Down.
You can click on it to get a large-scale image and save it for further reference:
If you have any questions regarding this Japanese candlestick patterns cheat sheet or if you have your own idea for a cheat sheet that could help in Forex trading, please proceed to our Forex forum to discuss this with other traders.
If you want to get news of the most recent updates to our guides or anything else related to Forex trading, you can subscribe to our monthly newsletter.