Average Directional Index
Average directional index (ADX) is another indicator invented by Welles Wilder in 1978. ADX can be very hard to use if you are visually attuned to a line that is moving upward always meaning that it is the price that is moving upward. In fact, ADX measures trend strength without regard for trend direction, so the ADX line can be moving upward as a downtrend is gathering strength.
ADX is usually named as a leading indicator on the grounds that momentum starts to fade ahead of the price peaking or bottoming and then reversing. This was Wilder’s assumption, and on the whole, it is sound, but remember that all momentum indicators perform best in trending conditions and give false signals in range-trading conditions. In fact, a primary application of ADX is to differentiate between trending and range-trading conditions.
The ADX is almost always plotted together with two other indicators that deliver direction, the Minus Directional Indicator (-DI) and the Plus Directional Indicator (+DI). That way, you get both the strength of the trend and the direction.
ADX is plotted as a single line with values ranging from a low of zero to a high of 100. The 25 level is a dividing line between “weak or no trend” and trended. A trend becomes strong between 25 and 50, and very strong between 50 and 75. From 75 to 100, the trend is so strong that you should start looking at whether the price is overbought or oversold.
Using ADX is not hard, but calculating ADX is hideously complicated. Like most of Wilder’s indicators, it focuses on the relative highs and lows within the recent range, not the open/close relationship. First, you have to calculate directional movement, abbreviated DM. When the prices are trending upward, DM gets a plus sign, +DM. This is called the positive or Plus DM, and also the up move. If the direction is downward, DM gets a minus sign in front of it, or –DM. This is called the negative or Minus DM and also the down move.
+DM holds when today’s high minus yesterday’s high is positive (up move) and higher than yesterday’s low minus today’s low (down move) and greater than zero.
-DM is when the down move is > up move and the down move is > zero.
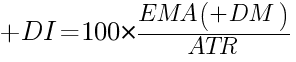
The actual +DI indicator is calculated as:
And the -DI part is calculated similarly:

Note that if +DM is negative, you use a zero for its value, and if the –DM indicator is positive, you use a zero. Wilder used a 14-day period for the DM and for ATR, but you are welcome to fiddle with other periods or to change the EMA (exponential moving average) to a different version.
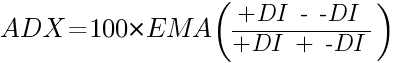
At last, we come to:
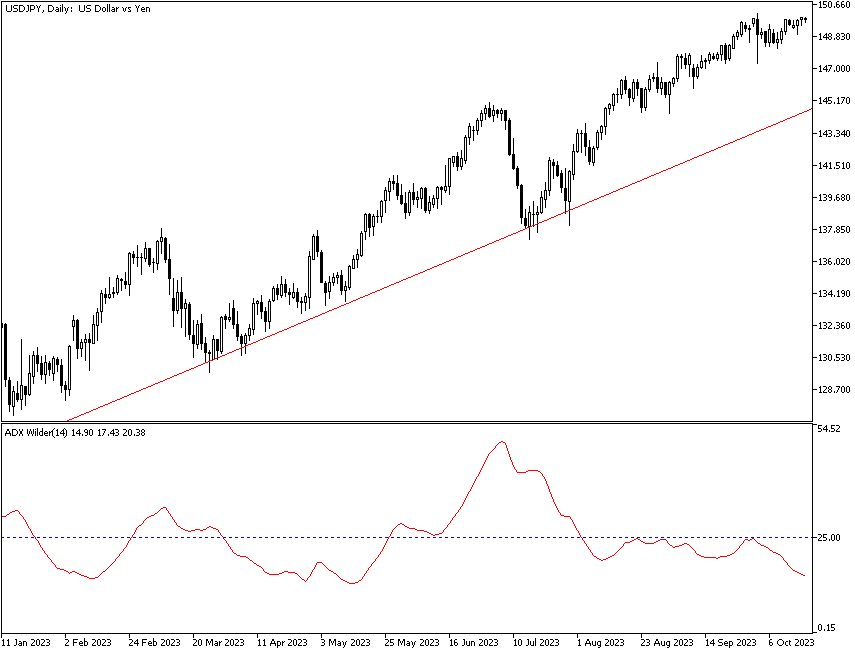
Wilder invented ADX (and all his indicators) before the advent of the PC. Luckily for us, every program today contains a canned version of ADX and the components, -DI and +DI. It may pay, however, to grasp the calculation methodology because there is a lot of smoothing going on in ADX. The DM components are smoothed if only by the elimination of inside days, and ADX is smoothed by dividing by the ATR. This has the virtue of delivering a really reliable indicator, but one that may lag and is hard to interpret. On the example chart below, we see an upmove in the price that starts 11 entire periods before the ADX line rises above 25, the criterion for a strong trend worth trading.
ADX in Action
Now, let’s add +DI, shown in the chart below (blue dashed line). The left-hand crossover of the +DI line with the red ADX line shows that an uptrend is forming. The right-hand crossover shows it is ending. Consider the left-hand crossover for a minute. It would seem to be late to the party. But look at the prices again — they are ranging, not trending.

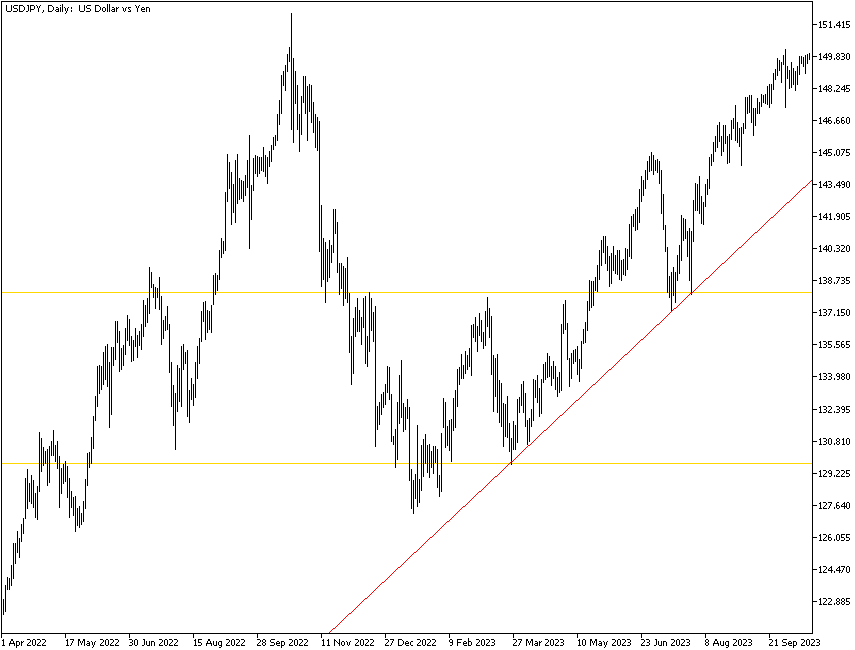
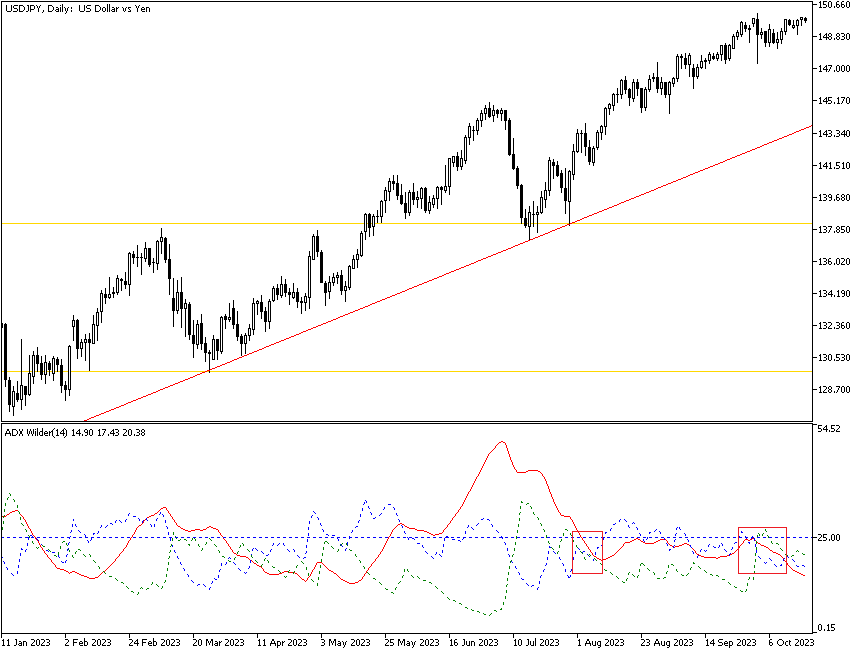
The next chart shows a bigger picture of the same situation. We were able to draw a red rising support line, and that may blind us to the unhappy sideways movement marked by the gold lines. We do not have a breakout above the previous high until the end of the gold lines. Our eyes may miss it, but ADX identified it correctly. If you are deeply risk averse, ADX can become your new best friend.
Now, see the chart with all the ADX components. –DI is green. Note that as the price in the top window starts to rise, -DI falls below +DI and stays there most of the time as the uptrend develops. As in all crossover systems, +DI rising above –DI is a buy signal. Do not be misled by a falling indicator line. It refers to the strength of the upmove decreasing and does not reflect the price itself. Here, the –DI crossing above the +DI is a sell signal. But with all the lines falling, the market looks trendless. Therefore, it is better to wait for new developments before making any decision.
Unfortunately, you will get a lot of extraneous crossovers, and it can be easy to get hopelessly confused. That is why using other confirming indicators with ADX is a good idea, including MACD and pattern recognition.