Fibonacci Extensions
Just as retracements are assumed to end at or near a Fibonacci number, the core assumption of Fibonacci extensions is that when a trend resumes, it will go as far as a Fibonacci number. The idea is that you can use a Fibonacci extension as a price target just as you can use a Fibonacci number as a stop. The extension is also named “projection,” which reflects that the extension is an effort to identify support or resistance in the future.
The default levels are 0.0%, 23.6%, 38.2%, 50.0%, 61.8%, 100.0%, 161.8%, 261.8%, and 423.6%. As noted in the previous lesson, 50% and 100% are not Fibonacci numbers but have an obvious appeal to the pattern-seeking human brain and were adopted by W.D. Gann as key numbers.
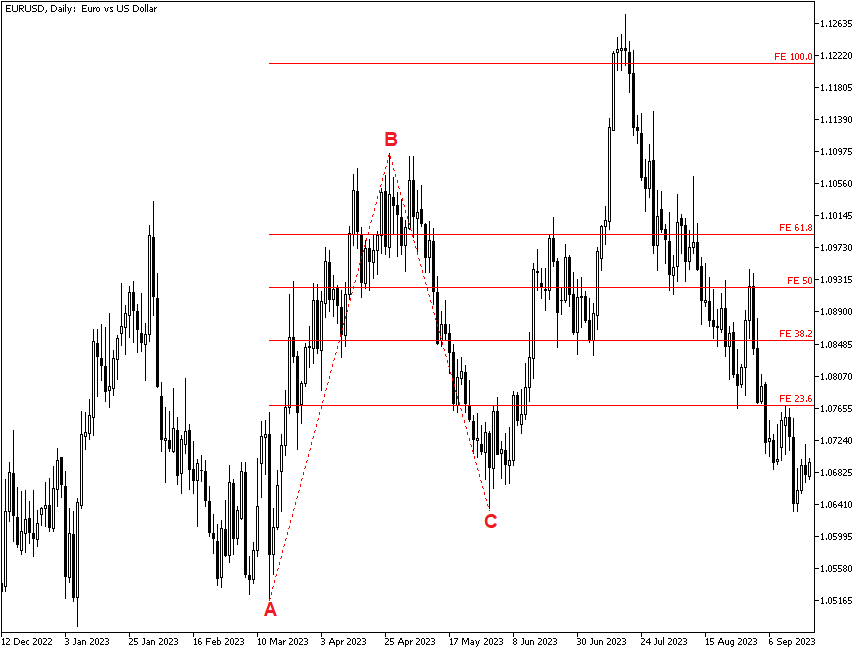
See the example chart below. Point A marks a low, and Point B marks the high before a pullback. If we assume the pullback is temporary and will revolve itself back into an upmove, we want to know how far it will go. Subtract the price at Point A from the price at Point B and multiply the low at Point C by each of the various Fibonacci numbers as a percentage. The 50% level here represents 50% of the move from A to B applied to C.
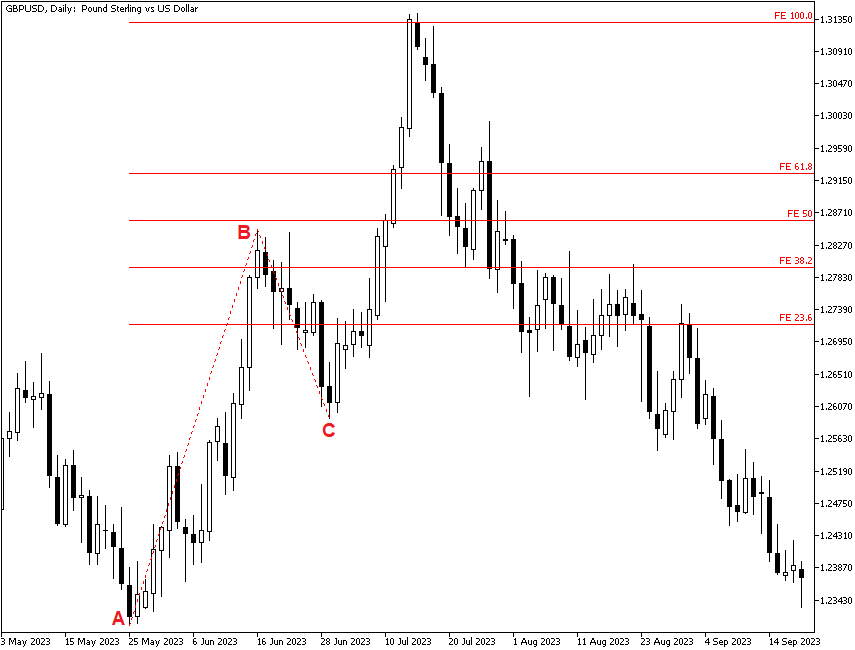
The next chart shows another example of the Fibonacci extension. Again, the percentages shown after Point C are based on the move from Point A to Point B. The currency (which happens to be the sterling) touches the 100% projection amount before proceeding to pull back to the level at which the initial rally had started.
One criticism of Fibonacci projections is that choosing starting and ending points (Points A and B) is subjective. What if, for example, after setting Point C we would get a lower low before resuming the rally? Should that invalidate the selection of Point C? In practice, it usually does not make much difference.
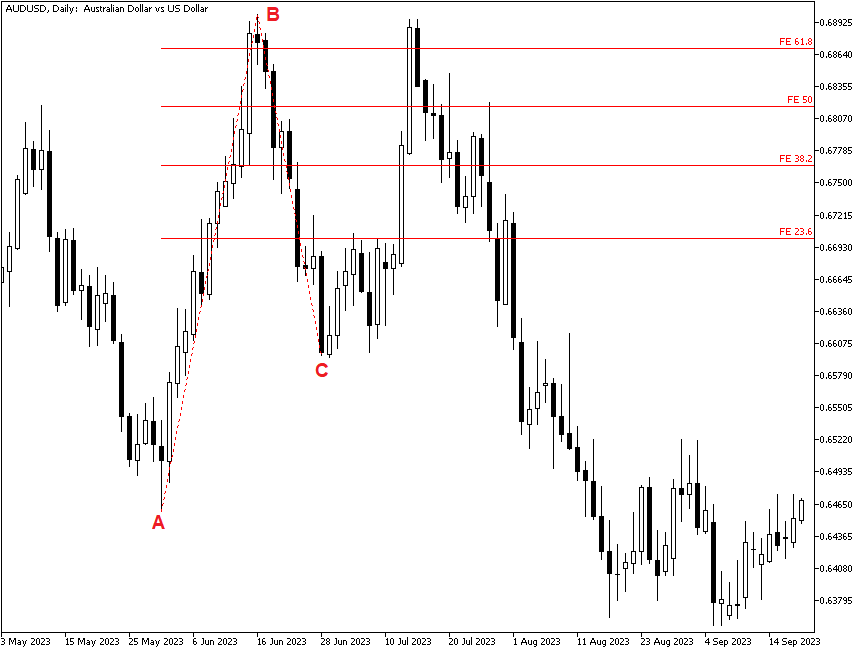
The bigger criticism is that Forex market trends change for real-world reasons. See the figure below. This happens to be the AUD/USD, which halted its up move because of geopolitical events (resulting in a rise of risk aversion), hawkish comments from the Federal Reserve bolstering the US dollar, concerns about China's economic performance, and other developments. AUD/USD managed to rise slightly above the 61.8% projection level, but after that, the currency pair retreated below the rally's initial starting level. And that is the biggest problem — we do get runaway moves in Forex in which Fibonacci projections might be useful, but we also get reversion to the mean, or even a return back to the starting level, and range-trading situations. You never know in advance which you are going to get. Because of these drawbacks, Fibonacci projections are of limited usefulness.
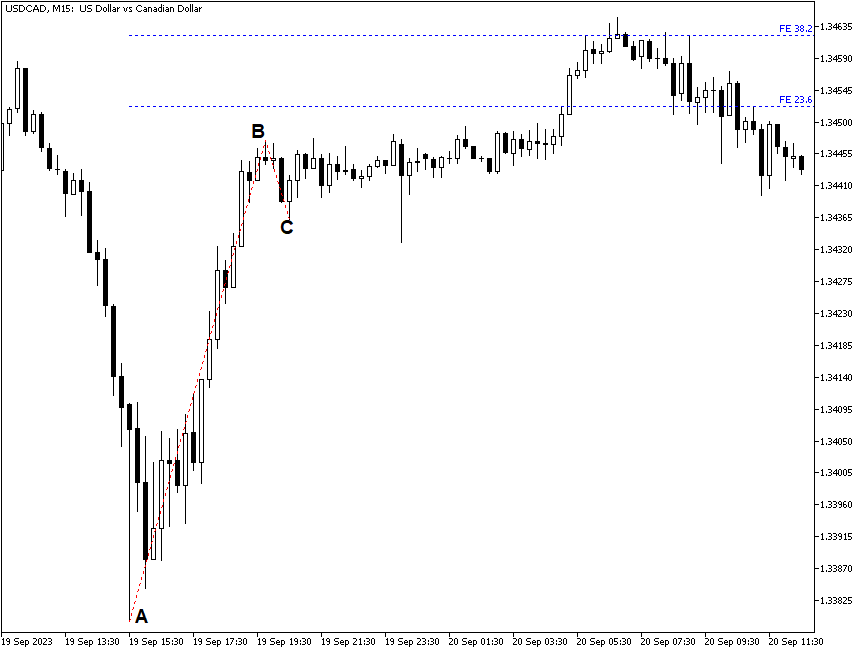
What about Fibonacci projections on intraday charts? Please see the next chart, which is USD/CAD on the 15-minute timeframe. The black letters mark out Points A and B. Point C is where the blue projection lines start. This chart shows 23.6% as the first projection line and 38.2% as the second. The currency pair reached the second projection line before returning back below the first one. So far, the USD/CAD pair was moving largely in a range, and it is impossible to tell whether it will go back to the projection lines or retreat below the C level.
What is the difference between a Fibonacci projection and a measured move? A measured move, which was the old-school terminology in use before Fibonacci numbers captured the market’s imagination, is the assumption that a rally after a pullback will be about equal in terms of percentage gain to the original rally. Overall, it will be about the same as the slope (momentum), too. Nowadays, analysts who speak about a measured move add 38% and 62% as estimates of the size as well as the older 100%. We could, therefore, think of Fibonacci projections as a sub-set of the measured move.