Introducing Gann Angles
W.D Gann: The Man
William Delbert Gann born way back in 1878, went on to build a reputation as one of the most successful stock and commodities traders of his day. As well as being a particularly successful trader, W.D Gann became known for his ability to make highly accurate market forecasts. Gann began trading stocks in 1902 before opening his own brokerage firm in 1908. While Gann went onto be extremely successful, he went bust several times during his early trading career. Undeterred by his early failings, Gann continued to study the financial markets, with his research leading to some startling conclusions which ultimately underpin Gann theory. After 50 years of successfully trading the financial markets, W.D Gann retired to Florida where he wrote and taught on the subjects of financial markets.
Assumptions Made by Gann and Used in Gann Theory
Gann’s theory on how financial markets work is based on three assumptions:
- Price, time frame, and range are the only factors one needs to consider.
- Markets are cyclical.
- And most controversially, financial markets are geometric in design and function.
Gann contended that by studying past price action we would be able to accurately predict future price action. Gann strongly believed that human nature was fixed and this would show up in the behaviour of financial markets with price patterns, ultimately repeating themselves. Those who have come across Elliot Wave theory may notice that Elliot made the same assumption, holding that we can make trading decisions by looking out for certain repeating wave patterns. If you want to learn more about Elliot Wave Theory, you can do so here.
If Gann’s assumptions are correct, it should be possible to identify these repeating patterns and trade accordingly. Some of the assumptions underpinning Gann theory have been called into question more recently and there is an active ongoing debate about the usefulness of Gann theory.
Geometric Angles
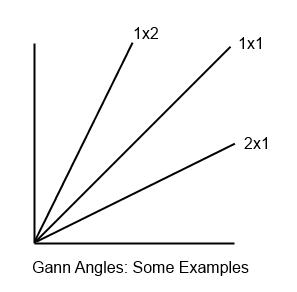
As already mentioned an important part of Gann made heavy use of geometric angles in conjunction with price and time. Gann believed that certain geometric angles had unique properties which could be used to predict future price action. Gann’s geometric approach requires that traders use equal price and time intervals, as this ensures a rise of 1x1 will always be equal to 45 degree angle. In the popular MetaTrader software, this can be achieved by setting the scale ratio 1 to 1.
Interpretation
Gann lines are to be drawn between a significant low and high or between a significant high and low, depending on which direction the market is heading. It was Gann’s belief that the ideal balance between time and price exists when prices fall or rise at a 45 degree angle. In the literature surrounding Gann Angles, this 45 degree angle is often referred to as 1x1, as price will have risen by one unit for each individual time unit. When prices are trending upwards, Gann believed price action in excess of 45 degree angle strongly suggests that the market is bullish, while price action below 45 degrees should be considered bearish. Gann also believed that the 1x1 trend line would provide significant a level of support during an uptrend and when prices fell below this angle this would signal the beginning of a price reversal. Gann indentified a total of nine different geometric angles but he always believed the 1x1 angle to be the most important.
Gann’s research led him to believe that each of these geometric angles could provide support or resistance deepening on the direction of the overriding trend. For instance, during a major uptrend, he contended that it was the 1x1 angle that tended to lend major support and any fall below this angle would suggest a significant price reversal. Gann believed that prices would then fall to the next significant geometric trend line. If the 1x1 angle was broken, prices would fall towards the 2x1 angle where they would again find support. Essentially, as one angle is broken, Gann expected prices to consolidate around the next significant geometic angle. Gann developed tools for study such price action including Gann fans, grids, and cardinal squares, which can be found in most comprehensive charting software packages.
Do Gann Angles Work?
Gann angles are viewed with significant suspicion by many traders who do not fully believe that price action conforms to particular geometric angles. There seems to be little empirical evidence to support Gann’s bold conjecture. Today, Gann angles are most commonly used by traders to determine where support and resistance levels might lie. With there being many different ways in which a trader can determine support and resistance levels, why would one choose to use Gann angles? Well, Gann angles introduce a new dimension to support and resistance studies with being possible for support and resistance levels to be diagonal.
If you want to get news of the most recent updates to our guides or anything else related to Forex trading, you can subscribe to our monthly newsletter.