A Beginner's Guide to the DeMarker Indicator in Forex
Contents
If you want to gauge whether an asset might be overbought or oversold while trading Forex, one tool you can use is the DeMarker indicator. This indicator also is sometimes called the "DeMark" indicator or simply "DeM." The name can also be stylized "DeMARK."
This 101 guide will explain exactly what the DeMarker indicator is, how it is calculated, and how to plot it on your charts and use it in your FX trading strategies.
What is the DeMarker indicator?
The DeMarker indicator is an oscillator. It was developed by the famous professional market predictor Thomas DeMark.
You can find a few different versions of this indicator:
- A line that oscillates between -100 and 100.
- A line that oscillates between 0 and 1.
Calculating the indicator involves a comparison between the highest and lowest prices for the current period versus the highest and lowest prices for the previous period.
The resulting line helps you visualize directional bias as well as overbought and oversold conditions.
How is the DeMarker indicator calculated?
The calculation for the DeMarker indicator is fairly complex to explain. Here is the formula:

In order to make any sense out of this formula, you need to know what each of the components are.
DeMMAX is a value derived from comparing the maximum value for the current bar to the maximum value of the previous bar over "n" periods.
If the previous high is higher than the current high, the value is "0."
Otherwise, the value is the difference between them.
DeMMIN is a value derived from comparing the minimum value for the current bar to the minimum value of the previous bar over "n" periods.
If the previous low is lower than the current low, the value is "0."
Otherwise, the value is the difference between them.
SMA refers to a simple moving average, and is used in MT4's calculations for this indicator.
Thankfully, you do not need to memorize or even fully understand this math. Your software will take care of the calculations for you.
What does the DeMarker indicator show?
When you plot this indicator on your Forex chart, you will notice that it includes a pair of dotted lines at 0.70 and 0.30.
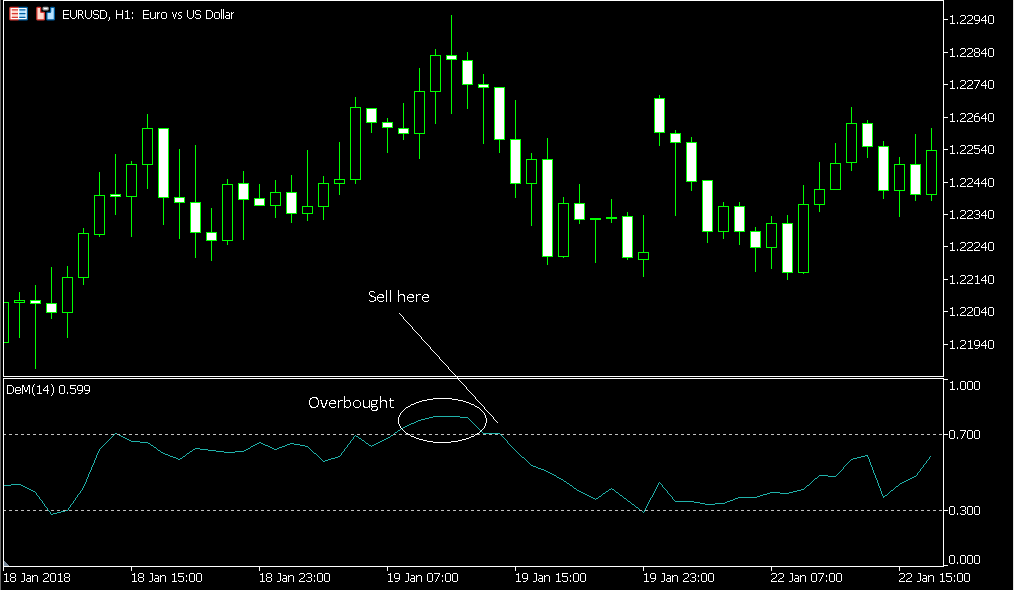
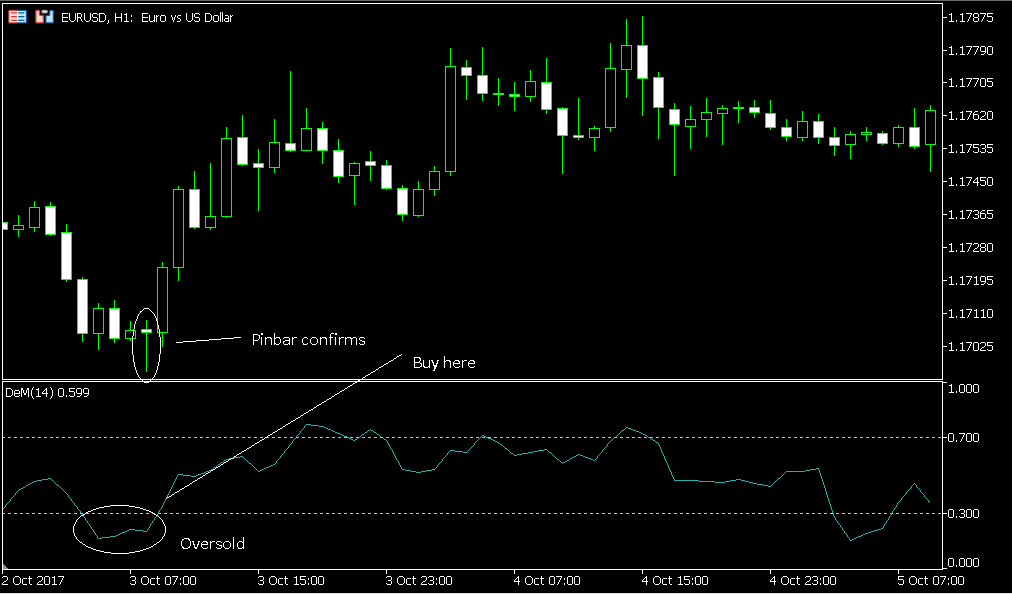
When the oscillating line passes above 0.70, that is an indication that the market conditions may be overbought. When the oscillating line passes below 0.30, that is an indication that the conditions may be oversold.
How to plot the DeMarker indicator on your charts?
It is fast and easy to set up the DeM in MT4. Use the following steps.
- Go to the top menu. Click on Insert, then Indicators, then Oscillators. Then click on DeMarker.
- A dialog box will open with tabs for Parameters, Levels, Scale, and Visualization.
- Under Parameters, you can find the default period of 14. Adjust it if you wish.
- Next, navigate to the Scale tab.
- There are, you can specify whatever minimum and maximum value you want. We recommend that you input "0" and "1," and check the boxes that say "fixed minimum" and "fixed maximum."
- This will display the indicator on your chart with 1 at the top and zero at the bottom. You will see the dotted lines at 0.30 and 0.70.
- You are now ready to use the DeM in your Forex trading.
- If the indicator goes above 0.70, market conditions may be overbought. Wait for the indicator to drop back below 0.70, and then sell.
- If the indicator goes below 0.30, market conditions may be oversold. Wait for the indicator to rise back above 0.30, and then buy.
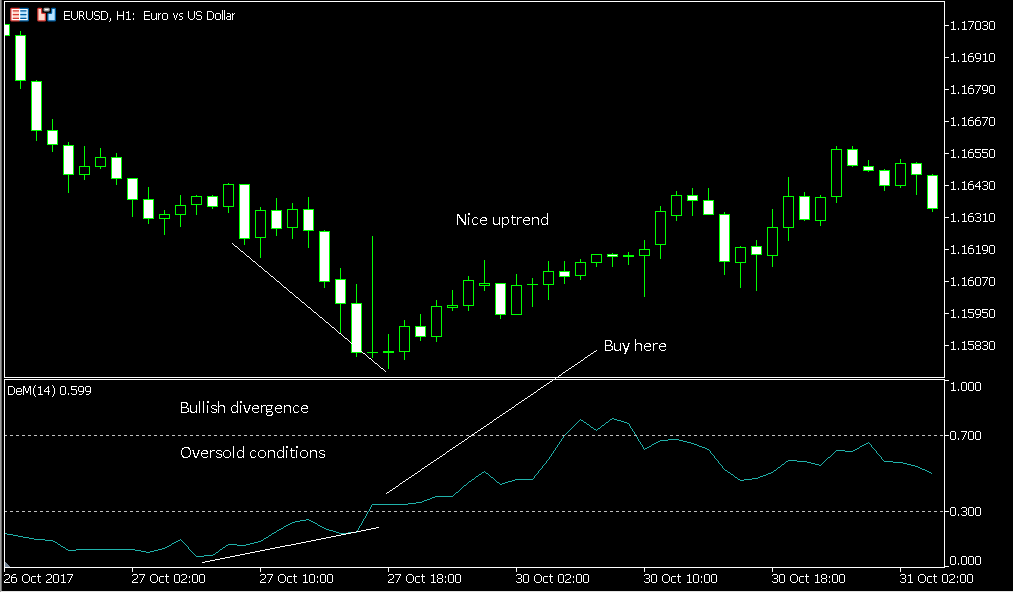
- When price is falling (lower lows), but the DeM is rising (higher lows), that is bullish divergence. You should buy.
- When price is rising (higher highs), but the DeM is dropping (lower highs), that is bearish divergence. You should sell.
- Try adjusting the parameters. You can not only adjust the minimum and maximum for this indicator, but also the boundary lines for overbought and oversold conditions. You may want to push these boundaries outward if you have small number of periods.
- Look for confirmation. The DeMarker indicator used in isolation is not reliable enough to comprise a working system. You should pair it with another indicator or with price action to provide confluence. In fact, you could even use it for context, with price patterns or other indicators constituting your setups.
- Test your system. Whatever settings you choose for this indicator and whatever approach you take to trading, it is essential to backtest and then demo test your strategy before risking real money on live Forex trades.
How to use the DeMarker indicator while you trade?
The simplest way to use the DeMarker indicator is to spot potential reversals. This can play out in either of two ways:
Some people like to exit around 0.50, while others may try to ride out trends.
Sometimes, you also will spot divergences between price and the oscillator. This can also result in bullish and bearish setups:
General tips for using the DeMarker indicator
Conclusion
The DeM can help you spot reversals in Forex. Whether you are keeping an eye on the overbought and oversold zones or looking for divergences, the DeMarker indicator can help you identify setups where price might reverse.
While you may spot setups using nothing but the DeM, it is most powerful and reliable when used in conjunction with other indicators or price action.
If you want to get news of the most recent updates to our guides or anything else related to Forex trading, you can subscribe to our monthly newsletter.