Forex Chart Patterns
Trading with the chart patterns can be easy if you know how to distinguish them and how to place the entry and exit orders correctly. There are many different chart patterns recognized by the expert financial traders. But, in my opinion, in Forex trading, there are five most important and rather frequently appearing patterns: ascending, descending and symmetrical triangles, and rising and falling wedges. Here you will find the models of these patterns and their descriptions:
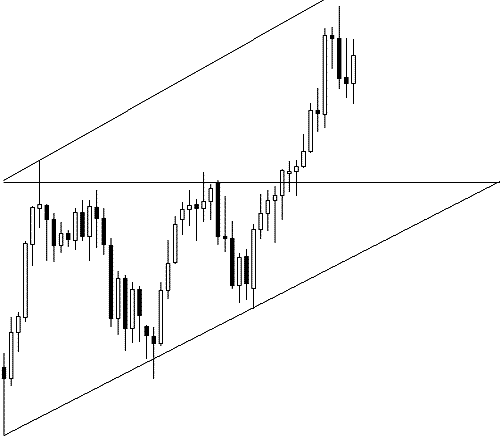
Ascending Triangle
Generally, it is a bullish continuation pattern, but a breakout in each direction is possible. If you like taking risk, you can go long immediately after you spot this pattern. But if you want to be careful, it is recommended to wait until breakout appears in either side. The most important parts of the ascending triangle are the horizontal line and the upwardly sloping line. It is also important for the price rate to touch each of those lines at least twice before the breakout materializes. This rule is vital for all of the five Forex chart patterns presented in this article. As you can see on the image, the price has touched the sloping line three times and the horizontal line two times, and then broke out through the latter.
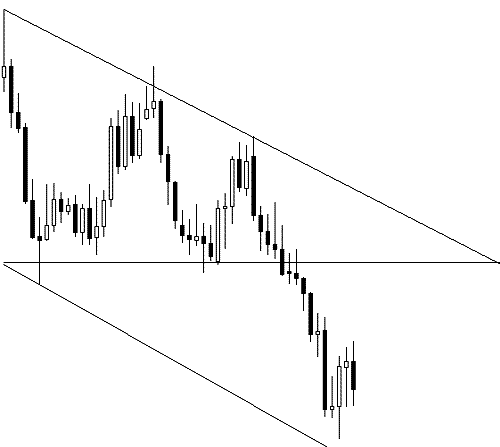
Descending Triangle
A descending triangle is a bearish continuation pattern, but a breakout in each direction is possible. As with the previous pattern, you can go short immediately after you spot it. Wait for breakout in either side to enter a
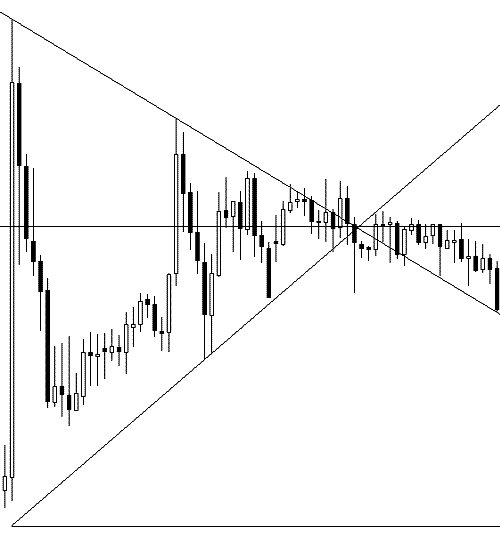
Symmetrical Triangle
Same as with two other triangles, it is a continuation pattern that breaks out in the direction of the previous trend. However, in practice, a breakout in every direction is possible. As always, you may decide to open a position in the direction of the previous trend immediately when you spot this triangle. If you wait for the breakout to occur, then you will have better chances for success. The most important parts of the symmetrical triangle are the downwardly and upwardly sloping lines and the horizontal line that bisects the angle created by the first two lines. The last line should be really horizontal (some degrees of error are OK) or otherwise it is some kind of a wedge but not a symmetrical triangle. As always, the price should touch each of the main sloping lines at least twice before the breakout happens. The symmetrical triangle, which is shown on the image, breaks out downwardly after touching the bottom line three times and the top line multiple times.
Rising Wedge
Usually, this chart pattern signals a reversal from the previous trend, but both upward and downward breakouts are possible. You can enter a risky trade immediately when you see this pattern. Wait for a clear breakout to enter a more probable trade. The crucial parts of the rising wedge are the two upwardly sloped lines that form a wedge. The price should touch each of them at least twice before the breakout occurs. On the image below, you can see that the price touched the top line two times and the bottom line multiple times. The downward breakout is shown.
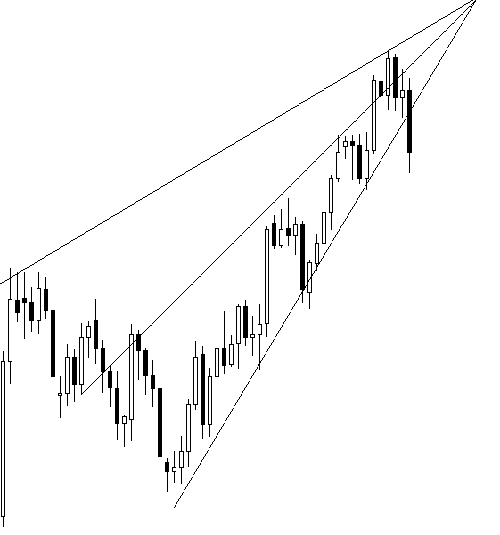
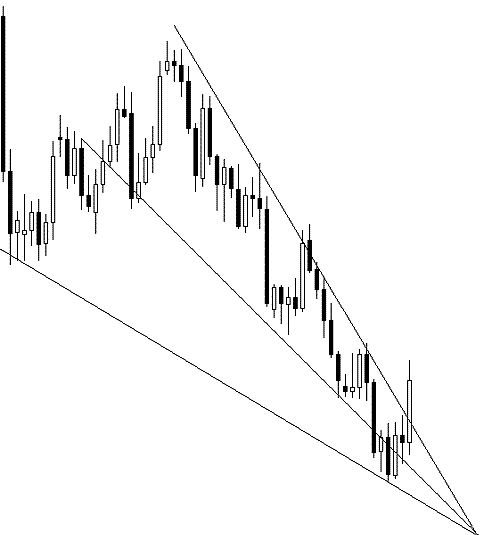
Falling Wedge
As its rising cousin, this chart pattern often signals a reversal from the previous trend, but both upward and downward breakouts are still possible. To enter a risky trade, open it as soon as you see this chart pattern. Wait for a clear breakout to enter a more probable trade. The main parts of the falling wedge are two downwardly sloped lines that form a wedge. The price should touch each of them at least twice before the breakout. On the image you can see that the price touched the bottom line two times and the top line multiple times. The upward breakout is shown.
If you want to get news of the most recent updates to our guides or anything else related to Forex trading, you can subscribe to our monthly newsletter.