A Beginner's Guide to Williams' Percent Range Indicator in Forex
If you want to be able to gauge whether the market is overbought or oversold, one popular indicator you can add to your charts is the Williams' Percent Range, also written as Williams' %R. Sometimes you will see it without an apostrophe as well: Williams' Percent Range.
This guide will explain to you exactly what the Williams' Percent Range indicator is, how it is calculated, and how you can plot it on your charts and use it in your Forex trading.
What is the Williams' Percent Range indicator?
The Williams' Percent Range indicator is classified as a momentum indicator. When you plot it on your chart, it will appear below, showing you a line that bounces between two levels. It looks similar to the RSI indicator.
You can use the Williams' Percent Range indicator to trade reversals or to establish trend strength.
How is the Williams' Percent Range indicator calculated?
Here is the formula for computing the Williams' %R indicator:
When you plot the indicator on your chart, you will select a period. By default, this is often 14 days. The formula looks at the highest price and the lowest price within that time period along with the most recent Close.
Thankfully, you do not need to do this calculation yourself. Your Forex software will do all the math for you.
What does the Williams' Percent Range indicator show?
The Williams' Percent Range indicator shows overbought and oversold market conditions.
The two lines are -20 at the top and -80 at the bottom.
When you see the line moving above -20, this indicates that the market is overbought.
When you see the line moving below -80, this conversely indicates that the market is oversold.
How to plot the Williams' Percent Range indicator on your charts
You can plot the Williams' Percent Range indicator on your charts in MetaTrader 4 in a few easy steps.
- In the menu, click on Insert->Indicators->Oscillators. You will see the Williams' Percent Range indicator in this list. Click on it.
- In the Parameters tab, choose the period you want. The default levels are listed under the Levels tab: -80 and -20. You can edit them if you want. When you are all done, click on OK to add the indicator to your chart.
This is it! Check below the chart, and you will see the indicator. Now you can use it to trade.
How to use the Williams' Percent Range indicator while you trade
You can use the Williams' Percent Range indicator to help you spot trend reversals. But there is an important caveat regarding the timing of your entries.
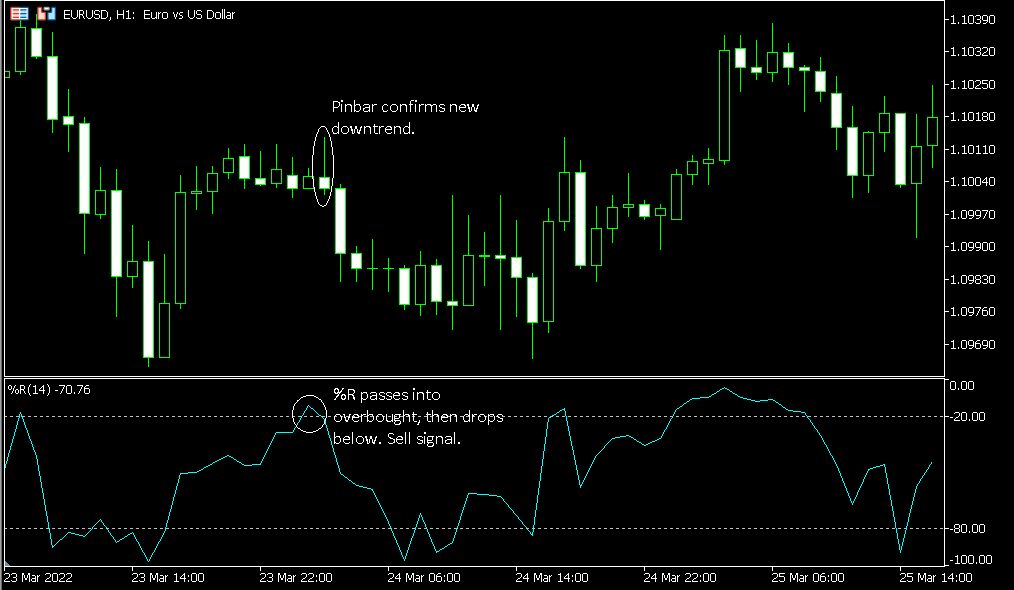
You might think the moment you see the line in the indicator crossing below -80, you should buy since conditions are oversold. Likewise, you might think that the instant the line crosses above -20, you should sell since conditions are overbought.
But actually, you should wait for price to pass back into the "normal" range from the overbought or oversold area before you get into a trade.
- When the market is trending upward, the indicator may rise above -20. If it does, wait for it to fall again. When it crosses back below -20, that means to sell.
- When the market is trending downward, the indicator may drop below -80. Wait for it to rise back above -80, and then buy.
There are also a couple of ways you can use this indicator during a trend.
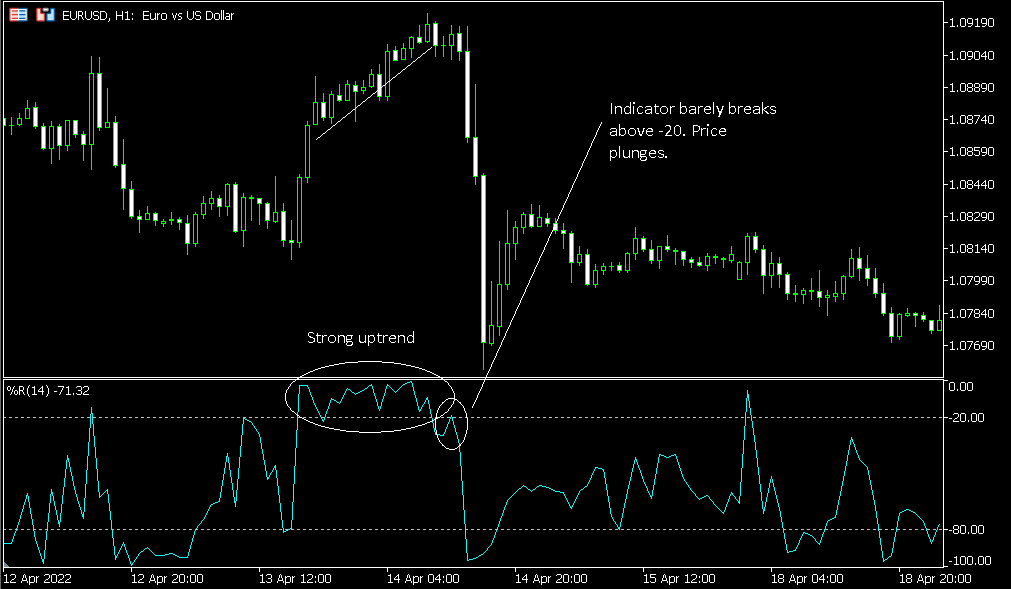
- When the market is trending upward, the indicator may repeatedly move above -20. When that happens, the uptrend is strong.
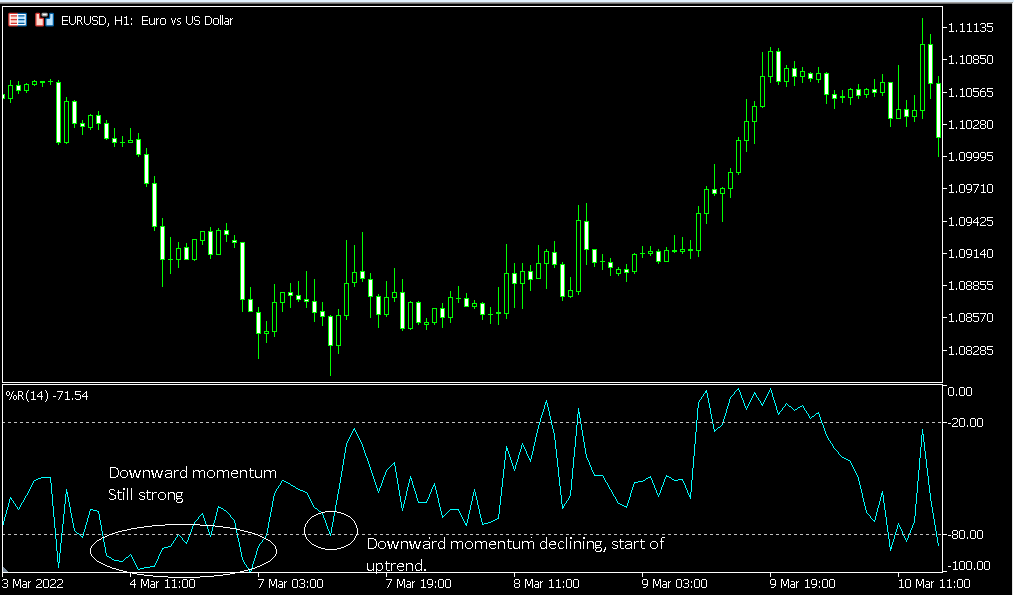
- If, during a downtrend, the indicator repeatedly crosses below -80, the downtrend is strong.
Also:
- If the market repeatedly crosses above -20, and then fails to do so the next time it tries, upward momentum is decreasing.
- If the market is repeatedly crossing below -80, and then fails to do so the next time it tries, downward momentum is declining.
So, if you determine that the trend is still strong, you could consider trading with the trend. If you determine that the trend's momentum is decreasing, you could consider exiting (and maybe even reversing your position).
General tips for using the Williams' Percent Range indicator
You have the basic idea now for how to use the Williams' Percent Range indicator. Below are a few things to keep in mind as you trade:
- Time entries with great care. Consider a situation where price has been rising and you see it pass above -20. You might think that if you immediately sell, you will get in on the beginning of a reversal early. But remember, it is possible for price to hover in the overbought range for some time. It also can drop back into the normal range and rise repeatedly in the middle of an uptrend. That is why it is wise to wait until price drops down below -20 if you want to sell. But even then, there are no guarantees. The indicator could pop right back up again while price continues to rise.
- Check for confluence. One way you can frame situations like the one above with more context is by using additional indicators, drawing tools or price patterns on your charts. If you are getting the same signal from more than one, you may have a stronger setup and a better idea of what is unfolding.
- Test before going live. Whatever rules you come up with for entering and exiting trades, backtest and demo test your strategies before you trade with real money.
Conclusions
The Williams' Percent Range can help you spot reversals and continuations in Forex.
The Williams' %R indicator is a useful oscillator for identifying when market conditions are overbought and oversold.
But whether it is telling you to trade with the trend or get in on a reversal can be challenging to interpret.
Look up trading methods that use Williams' %R or try creating your own, incorporating additional indicators for confluence.
You can discuss the Williams' Percentage Range indicator and its application in Forex trading on our forum for traders.
If you want to get news of the most recent updates to our guides or anything else related to Forex trading, you can subscribe to our monthly newsletter.