Bollinger Bands
Bollinger Bands are a trend indicator that detects the volatility and dynamics of the price movement in Forex market. It was developed in the 80's by John Bollinger to trade in the stock market. It is a part of the standard kit of the MetaTrader 4 trading platform. The indicator is used to measure volatility and to forecast the current trend turnarounds or continuation.
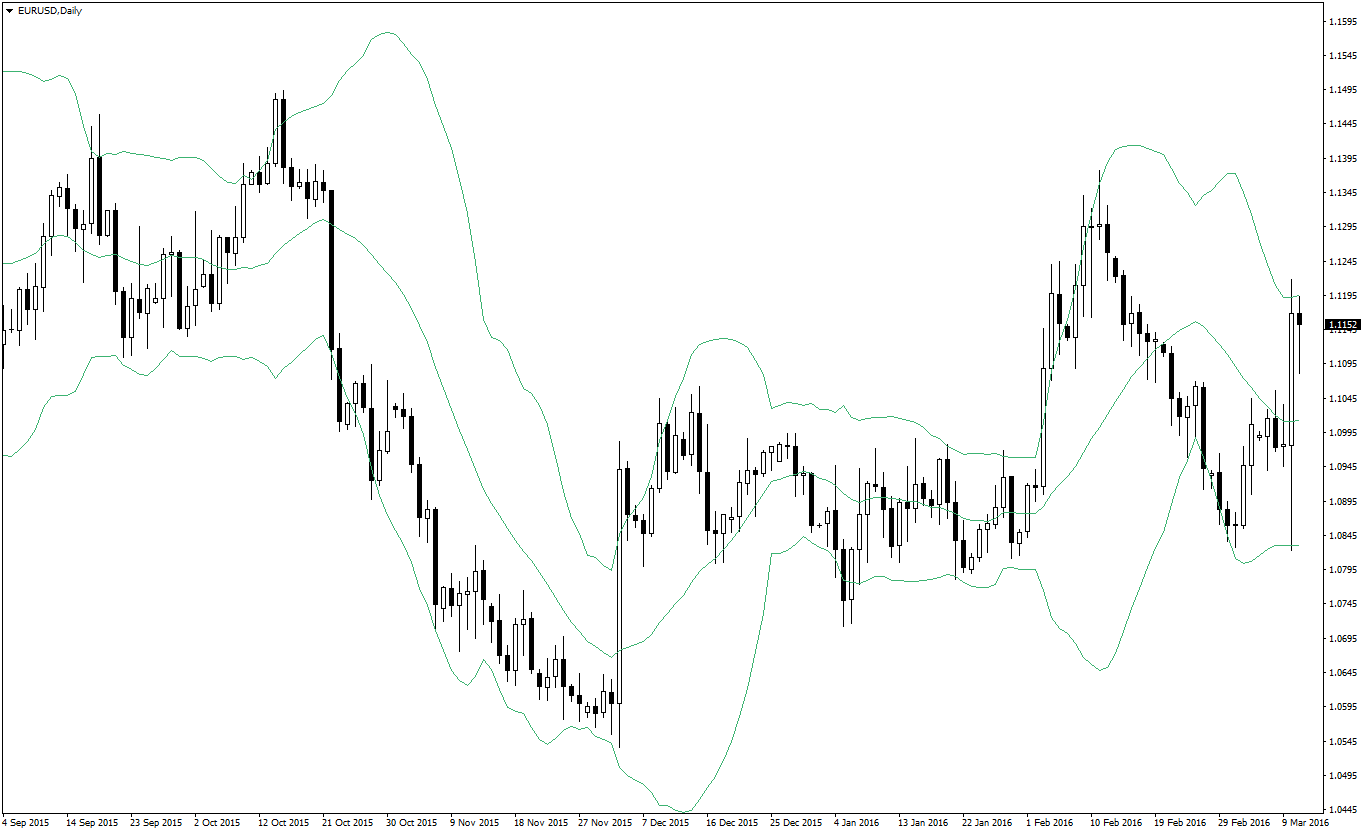
Bollinger Bands indicator on chart
Bollinger Bands indicator comprises three directed lines. The central line is the simple moving average (SMA) with the period of 20. The lower line is the central line minus two standard deviations. The upper line of the Bollinger Bands is the same SMA(20) plus two standard deviations. Below you can see how the indicator attached to the daily chart of the EUR/USD currency pair:
Formula
The central line of the Bollinger Bands indicator is calculated using the moving average formula using the closing prices of the latest 20 bars:
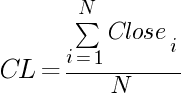
where CL — central line,
Closei — close price of the candle number i,
N — period of the BB.
Before proceeding to the formula of the upper and lower bands, we have to calculate the standard deviation:

where SD — standard deviation,
Closei — close price of the candle number i,
CL — average value for the N periods (calculated as the central line earlier),
N — period of the BB.
In other words, you need to subtract the average price from every close price, sum up the squares of the differences, divide by the number of periods, and find the square root from the result to get the standard deviation. The standard settings for the number of candles in Bollinger Bands is 20.
The lower band is corrected using two standard deviations according to this formula:
LL = CL – 2 × SD,
where LL — lower line,
SD — standard deviation.
The upper line is calculated in a similar manner:
UL = CL + 2 × SD,
where UL — the upper line of the Bollinger Bands.
Calculation example
Because the indicator is made up of three lines, the results of the calculation will contain three different numbers for a given bar:
- The central line price values.
- The lower line price values.
- The upper line price values.
We can use the the EUR/USD quotes for the beginning of 2016 to illustrate the calculation process. The closing prices for the first 20 days of the year are presented below:
| i | Close |
|---|---|
| 1 | 1.0832 |
| 2 | 1.0746 |
| 3 | 1.0780 |
| 4 | 1.0929 |
| 5 | 1.0925 |
| 6 | 1.0858 |
| 7 | 1.0857 |
| 8 | 1.0876 |
| 9 | 1.0863 |
| 10 | 1.0913 |
| 11 | 1.0894 |
| 12 | 1.0907 |
| 13 | 1.0888 |
| 14 | 1.0873 |
| 15 | 1.0797 |
| 16 | 1.0848 |
| 17 | 1.0868 |
| 18 | 1.0892 |
| 19 | 1.0939 |
| 20 | 1.0830 |
| 21 | 1.0887 |
| 22 | 1.0918 |
| 23 | 1.1102 |
| 24 | 1.1207 |
| 25 | 1.1158 |
The calculation of the 21st candle of the Bollinger Bands' central line looks like this:
CL21 = (1.0832 + 1.0746 + 1.0780 + 1.0929 + 1.0925 + 1.0858 + 1.0857 + 1.0876 + 1.0863 + 1.0913 + 1.0894 + 1.0907 + 1.0888 + 1.0873 + 1.0797 + 1.0848 + 1.0868 + 1.0892 + 1.0939 + 1.0830) / 20
CL21 = 1.0866
The central line values for the next candles are calculated in the same way. The easiest way to do it is to use the Microsoft Office Excel or LibreOffice Calc tables. The results are presented below:
| i | Close | CL |
|---|---|---|
| 21 | 1.0887 | 1.0866 |
| 22 | 1.0918 | 1.0869 |
| 23 | 1.1102 | 1.0877 |
| 24 | 1.1207 | 1.0893 |
| 25 | 1.1158 | 1.0907 |
The next stage is the standard deviation calculation. Doing it manually would be cumbersome, so we will employ the same software to get the following results:
| i | Close | CL | SD |
|---|---|---|---|
| 21 | 1.0887 | 1.0866 | 0.0050 |
| 22 | 1.0918 | 1.0869 | 0.0050 |
| 23 | 1.1102 | 1.0877 | 0.0042 |
| 24 | 1.1207 | 1.0893 | 0.0060 |
| 25 | 1.1158 | 1.0907 | 0.0093 |
Let's compute the Bollinger Bands' upper line for the candles #21-25:
UL21 = 1.0866 + 2 × 0.0050 = 1.0967;
UL22 = 1.0869 + 2 × 0.0050 = 1.0968;
UL23 = 1.0877 + 2 × 0.0042 = 1.0961;
UL24 = 1.0893 + 2 × 0.0060 = 1.1014;
UL25 = 1.0907 + 2 × 0.0093 = 1.1092.
The values of the lower line:
LL21 = 1.0866 - 2 × 0.0050 = 1.0765;
LL22 = 1.0869 - 2 × 0.0050 = 1.0769;
LL23 = 1.0877 - 2 × 0.0042 = 1.0793;
LL24 = 1.0893 - 2 × 0.0060 = 1.0772;
LL25 = 1.0907 - 2 × 0.0093 = 1.0722.
Usage in trading
You can use the following assumptions when trading Forex using the Bollinger Bands indicator:
- The currency pair's range of motion is within the upper and lower lines. If the price comes close to one of the boundaries, the opposite boundary will serve as the price's next target unless there is a breakout.
- If the price is fluctuating near the upper or lower band for too long, the pair is in the uptrend or in the downtrend, respectively. The opposite boundary can be viewed as the support or resistance line.
- The distance between the bands is decreasing during the periods of low volatility. A strong trending movement usually follows such periods after breakout.
- Two new local maximums or minimums serve as the direction change signal. One should be outside of the Bollinger Bands, another — inside them.
- Closing above or below the bands range is a signal for trend strengthening and continuation if the boundary line is directed the same way as the price.
- If the price goes above the upper line but the line is heading down, it is a sell signal with the lower line as the target. The same is true for the opposite direction. Requires confirmation.
- The indicator provides no 100% correct forecasts for the currency pair's movement. You have to do additional market analysis in case the price touches one of the lines and you have to find confirmation signals from other indicators or from the chart patterns.
- Standard settings are based on the simple moving average with the period of 20 and the number of standard deviations equaling 2. The indicator was developed for equities trading. Considering the fact that each trading instrument has its own unique properties, it is worth experimenting with the settings by changing the moving average type and period, and by adjusting the number of standard deviations.
Sources:
- John Bollinger, Bollinger on Bollinger Bands ISBN 9780071386739
- https://ctdn.com/algos/indicators/show/92
- https://www.metatrader5.com/en/terminal/help/indicators/trend_indicators/bb
If you want to get news of the most recent updates to our guides or anything else related to Forex trading, you can subscribe to our monthly newsletter.